
Authored by Michael Lebowitz via RealInvestmentAdvice.com,
The 1987 stock market crash, better known as Black Monday, is frequently deemed a historical anomaly. Unlike the crashes of 1929, 2000, 2008 and other smaller ones, many investors are under the false premise that the stock market in 1987 provided no warning of the impending crash. On Black Monday, October 19, 1987, the Dow Jones Industrial Average (DJIA) fell 22.6% in the greatest one-day loss ever recorded on Wall Street. Despite varying perceptions, there were clear fundamental and technical warnings preceding the crash that were detected by a few investors. For the rest, the market euphoria raging at the time blinded them to what in hindsight seemed obvious.
As of just last week, the market was in a state of euphoric complacency, donning a ‘what could go wrong’ brashness and extrapolating good times as far as the eye can see. While we respected the bullish price action, we also appreciated that investors were not properly assessing fundamental factors that overwhelmingly argue the market is grossly overvalued. Whether prices revert to more normal levels via a long period of market malaise or a single large drawdown as we are seeing, we do not know. Historically situations with the largest fundamental imbalances ended with powerful failures that quickly erased years of gains.

Frankly, it is easy to demonstrate the fundamental factors that could cause a meltdown, but it is difficult to predict when it might occur. In this series of articles, we explore the market peaks of 1929, 1987, 1999 and 2007 and the fundamental and technical conditions that prevailed during those periods. Since each episode has different attributes, we cannot provide a comprehensive checklist of the fundamental and technical conditions that must occur before the market peaks this time. However, history provides us with the gift of insight, and though history will not repeat itself, it may rhyme.
Fundamental Causes
Below is a summary of some of the fundamental dynamics that played a role in the market rally and the ultimate crash of 1987.
Takeover Tax Bill- During the market rally preceding the crash, corporate takeover fever was running hot. Leveraged Buyouts (LBOs), in which high yield debt was used to purchase companies, were stoking the large majority of stocks higher. Investors were betting on rumors of companies being taken over and were participating in strategies such as takeover risk arbitrage. A big determinant driving LBOs was the acquirer’s ability to raise the necessary capital through debt issuance. The enthusiasm for more LBO’s, similar to buybacks today, fueled speculation and enthusiasm across the stock market. On October 13, 1987, Congress introduced a bill that sought to rescind the tax deduction for interest on debt used in corporate takeovers. This bill raised concerns that the LBO machine would grind to a halt. From the date the bill was announced until the Friday before Black Monday, the market dropped over 10%.
Inflation/Interest Rates- In April 1980, annual inflation peaked at nearly 15%. By December of 1986, it had sharply reversed to a mere 1.18%. This would be the lowest level of inflation from that point until the financial crisis of 2008. Throughout 1987, inflation bucked the trend of the prior six years and hit 4.23% in September of 1987. Interest rates demonstrated a similar pattern as inflation during that period. In 1982, the yield on the ten-year U.S. Treasury note peaked at 15%, but it would close out 1986 at 7%. Like inflation, interest rates reversed the trend in 1987, and by October, the ten-year U.S. Treasury note yield was 3% higher at 10.23%. Higher interest rates made LBOs more costly and takeovers less likely, put pressure on economic growth and, most importantly, presented a rewarding alternative to owning stocks.
Deficit/Dollar- A frequently cited contributor to the market crash was the mounting trade deficit. From 1982 to 1987, the annual trade deficit was four times the average of the preceding five years. As a result, on October 14th Treasury Secretary James Baker suggested the need for a weaker dollar. Undoubtedly, concerns for dollar weakness led foreigners to exit dollar-denominated assets, adding momentum to rising interest rates. Not surprisingly, the S&P 500 fell 3% that day, in part due to Baker’s comments.
Valuations- From the trough in August 1982 to the peak in August 1987, the S&P 500 produced a total return (dividends included) of over 300%, or nearly 32% annualized. However, earnings over the same period rose a mere 8.1%. The valuation ratio, price to trailing twelve months earnings, expanded from 7.50 to 18.25. On the eve of the crash, this metric stood at a 33% premium to its average since 1924.
Technical Factors
This section examines technical warning signs in the days, weeks and months prior to Black Monday. Before proceeding, the chart below shows the longer term rally from the early 1980’s through the crash.
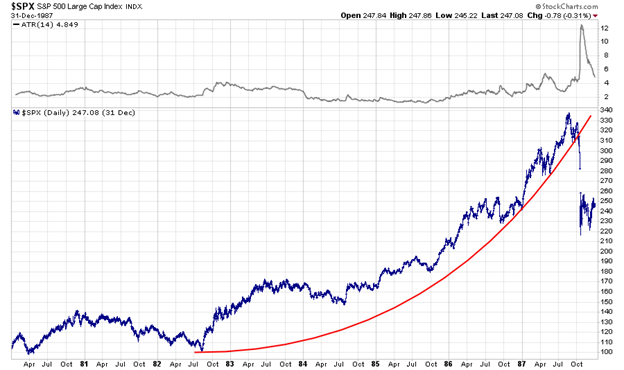
Portfolio Insurance- As mentioned, from the 1982 trough to the 1987 peak, the S&P 500 produced outsized gains for investors. Further, the pace of gains accelerated sharply in the last two years of the rally.
As the 1980’s progressed, some investors were increasingly concerned that the massive gains were outpacing the fundamental drivers of stock prices. Such anxiety led to the creation and popularity of portfolio insurance. This new hedging technique, used primarily by institutional investors, involved conditional contracts that sold short the S&P 500 futures contract if the market fell by a certain amount. This simple strategy was essentially a stop loss on a portfolio that avoided selling the actual portfolio assets. Importantly, the contracts ensured that more short sales would occur as the market sell-off continued. When the market began selling off, these insurance hedges began to kick in, swamping bidders and making a bad situation much worse. Because the strategy required incremental short sales as the market fell, selling begat selling, and a correction turned into an avalanche of panic.
Chris Cole of Artemis Capital estimates that, in 1987, portfolio insurance strategies comprised about two percent of the market. Currently, he estimates that short volatility trades, which if unwound would have a similar effect as portfolio insurance, is between six and ten percent of the market.
Price Activity- The rally from 1982 peaked on August 25, 1987, nearly two months before Black Monday. Over the next month, the S&P 500 fell about 8% before rebounding to 2.65% below the August highs. This condition, a “lower high,” was a warning that went unnoticed. From that point forward, the market headed decidedly lower. Following the rebound high, eight of the nine subsequent days just before Black Monday saw stocks in the red. For those that say the market did not give clues, it is quite likely that the 15% decline before Black Monday was the result of the so-called smart money heeding the clues and selling, hedging or buying portfolio insurance.
Annotated Technical Indicators
The following chart presents key technical warnings signs labeled and described below.
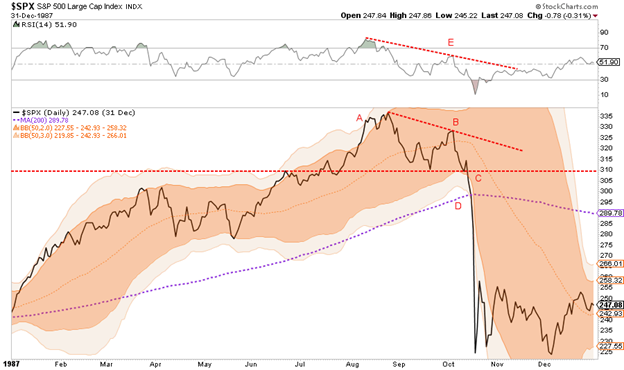
- A: 7/30/1987- Just before peaking in early August, the S&P 500 extended itself to three standard deviations from its 50-day moving average (3-standard deviation Bollinger band). This signaled the market was greatly overbought. (description of Bollinger Bands)
- B: 10/5/1987- After peaking and then declining to a more balanced market condition, the S&P 500 recovered but failed to reach the prior high.
- C: 10/14/1987- The S&P 500 price of 310 was a point of both support and resistance for the market over the prior two months. When the index price broke that line to the downside, it proved to be a critical breach from a technical perspective.
- D: 10/16/1987- On the eve of Black Monday, the S&P 500 fell below the 200-day moving average. Since 1985, that technical level provided dependable support to the market on five different occasions.
- E: August 1987- The relative strength indicator (RSI – above the S&P price graph) reached extremely overbought conditions in late July and early August (labeled green). When the market rebounded in early October to within 2.6% of the prior record high, the RSI was still well below its peak. This was a strong sign that the underlying strength of the market was waning. (description of RSI)
Volatility- From the beginning of the rally until the crash, the average weekly gain or loss on the S&P 500 was 1.54%. In the week leading up to Black Monday, volatility, as measured by five-day price changes, started spiking higher. By the Friday before Black Monday, the five-day price change was 8.63%, a level over six standard deviations from the norm and almost twice that of any other five-day period since the rally began.
Over the course of the rally from 1982, the average daily difference between the high and low (true range) of each trading day was just under 1.50%. In the week leading up to the crash, the average daily range doubled. On the Friday before the crash, it expanded to over 6%, or four standard deviations from the norm. A longer average true range is shown above the longer term S&P 500 at the start of the technical section.
Similarities and Differences
While comparing 1987 to today is helpful, the economic, political and market backdrops are quite different. There are however some similarities worth mentioning.
Currently:
- Interest rates are rising
- Federal deficits are increasing
- Weaker dollar policy was recently affirmed by Treasury Secretary Mnuchin
- Equity valuations are above almost every instance of the last 100+ years, regardless of how those valuations are measured
- Sentiment and expectations are at or near record levels.
- The use of margin is helping investors lever their holdings.
- Trading strategies such as short volatility positions can have a snowball effect, like portfolio insurance, if they are unwound
There are also vast differences. The economic backdrop of 1987 and today are nearly opposite.
- In 1987 baby boomers were on the verge of becoming an economic support engine. Today they are retiring and do not have the same economic effect.
- Debt to GDP has grown enormously since 1987.
- The amount of monetary stimulus in the system today is extreme, leaving one to question how much more can the Fed do.
- Productivity growth was robust in 1987, and today it has nearly ground to a halt.
While some of the fundamental drivers of 1987 may appear similar to today, the current economic situation leaves a lot to be desired when compared to 1987. After the 1987 market crash, the market rebounded quickly, hitting new highs by the spring of 1989.
We fear that, given the economic backdrop and challenging circumstances of both monetary and fiscal policy, recovery from an episodic event like that experienced in October 1987 may look vastly different today.
Summary
Market tops are said to be processes. Currently, there are an abundance of fundamental warnings but few if any technical signals that the market is at or near a peak. In fact, most technical indicators are waving the all-clear flag. It is worth noting that longer-term interest rates, a key driver of economic activity, have begun rising while shorter-term rates have been rising since late 2015. Given the role debt has played in economic growth and in supporting stock buybacks, it is likely that equities will not take kindly to further increases in interest rates.
Those looking back at 1987 may blame the tax legislation and warnings of a weaker dollar as the catalysts for the severe declines. In reality, those were just the sparks that started the fire. The market was overly optimistic and had gotten well ahead of itself. When the current market reverses course, investors are also likely to blame a specific catalyst or two. Like 1987, the true fundamental catalysts are already apparent; they are just waiting for a spark.
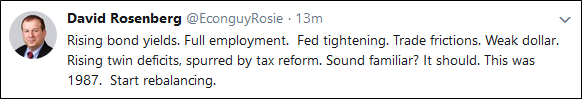
We leave you with an appropriate tweet from David Rosenberg, Chief Economist, and Strategist at Gluskin Sheff.
The post “1987” appeared first on crude-oil.news.