
2018 Cryptocurrency Crash (Elliott Wave): Symmetrical Triangle
2018 Cryptocurrency Crash ( Elliott Wave ): Symmetrical Triangle
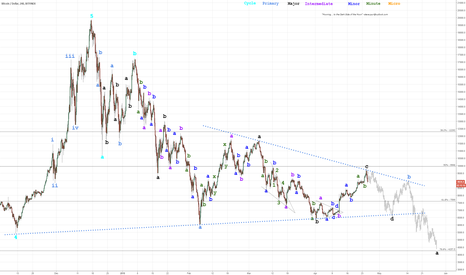
Since the 6425 (Bitfinex) low set on 01-APR-2018, the Bitcoin market has rallied 50% to retrace a Fibonacci 61.8% of the downtrend wave from 05-MAR-2018 to 01-APR-2018.
Prior to the rally, the downtrend wave from 05-MAR-2018 to 01-APR-2018 came within 95% of the low set on 06-FEB-2018, but failed to exceed it.
It appears converging price action in the Bitcoin market is undergoing a large Symmetrical Triangle formation since the 06-FEB-2018 low.
In regards to the internals of Symmetrical Triangle formation:
—wave-a: Rallied 95% from the 06-FEB to 05-MAR, retracing a 50% Fibonacci of the downtrend wave that began on 06-JAN.
—wave-b: Declined 45% from 05-MAR to 01-APR, retracing a 95% of wave-a.
—wave-c: Rallied 50% from 01-APR to 25-APR, retracing a Fibonacci 61.8% of wave-b at 9767 and thus far appears complete.
If wave-c subdivides, additional upside targets as follows:
1. @9946: 50% Fibonacci retracement of entire Bitcoin market.
2. @10571: 78.6% Fibonacci retracement of wave-b.
However, should wave-c be complete, it would suggest the entire Symmetrical Triangle forms beneath the psychological 10,000 level.
There are two further waves required to complete the Symmetrical Triangle pattern . Given the converging price action trendlines of the triangle, the following are projections for the two outstanding legs:
—wave-d: Currently underway since 25-APR. Expected to decline and retrace at least a Fibonacci 78.6% of wave-c towards 7140. Converging trendlines of the Symmetrical Triangle would suggest a 30% decline to approx 6750.
—wave-e: The final leg of the Symmetrical Triangle pattern , and the shortest. Expected to retrace between a Fibonacci 61.8% to 78.6% of wave-d, rallying approx 35% towards 8590 to 9100.
The converging trendlines suggest the Symmetrical Triangle pattern ought to complete by mid-May to early-Jun. At which point, the bear market is expected to resume towards 4257 which marks a Fibonacci 78.6% retracement of the entire Bitcoin market.
Speculative and guesswork Elliott Wave model indicative of price and structure not time, as follows:
BTC (4-hr): https://i.imgur.com/biQGkBl.png
BTC (Weekly): https://i.imgur.com/YEIpfAP.png
BTC (Daily): https://i.imgur.com/bMFFP3S.png