The advance decline line is a lesser known technical indicator compared to other more popular trading indicators such as the RSI, Stochastics, and MACD. While these other indicators are momentum based indicators, the A/D line indicator is unique in that it is a market breadth indicator. In this lesson, we will focus on a discussion of the A/D indicator and its application within the equities market.
Advance Decline Line Indicator
The advance decline line, also known as the A/D line is a popular market breadth indicator commonly used in the stock market. The A/D line essentially measures how many stocks are advancing in price relative to the number of stocks declining in price. And thus, when there are more stocks advancing than declining, the A/D line will register a net positive reading.
Alternatively, when there are more stocks declining than advancing, the A/D line will register a net negative reading. The advance decline line indicator can therefore be seen as a market sentiment study, measuring the overall bullishness or bearishness within the market as a whole.
The advance decline line indicator is used on major stock indexes such as the S&P 500, the Dow Jones, and the NASDAQ. There are various applications of the A/D line indicator that traders and investors should be aware of. We’ll cover some of the more prominent signals later in the section, however for now it’s important to understand that the advance decline line can help uncover trends within the broader market, and provide insights into the health of those trends, and potential reversal points.
For example, when the A/D line is increasing while the market index is decreasing, this can be a sign that fewer stocks are causing the bearish price movement, which could indicate that the downtrend may be nearing its completion. Similarly, when the A/D line is decreasing while the market index is increasing, this can be a sign that fewer stocks are participating in the bullish price movement, which could indicate that the uptrend may be nearing its completion.
The advance decline line provides us an inside look into the stock market to help us better gauge the current sentiment in the market. This is done by evaluating the net number of stock advances versus declines.
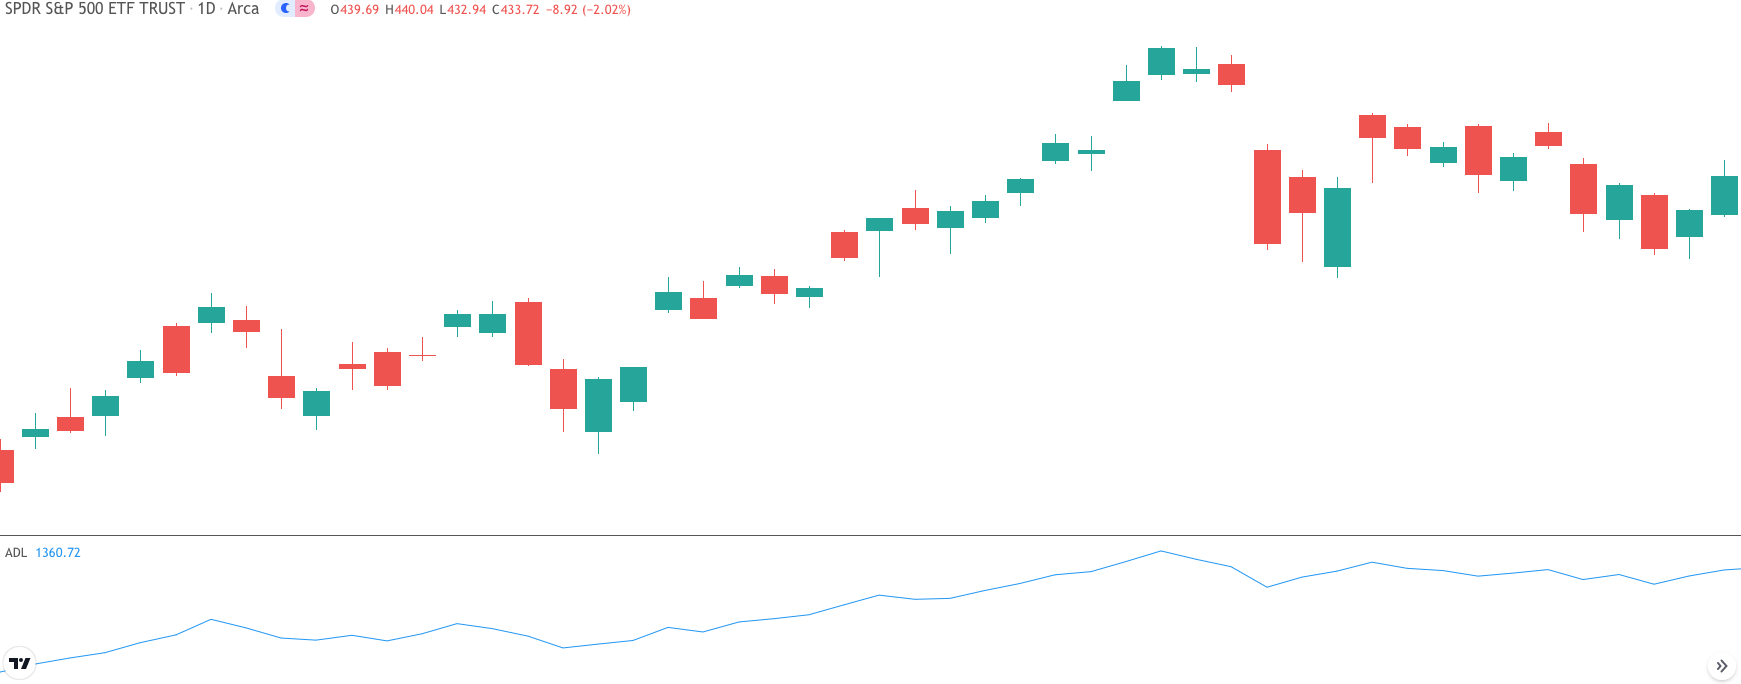
Below you can see a price of the S&P 500 SPY ETF, with the advance decline line chart plotted in the lower pane.
Advance/Decline Line Calculation
The A/D line is very simple to calculate and understand. Essentially there are three components to the advance decline line. The first is the advancing stocks, the second is the declining stocks, and the third is the previous net advances. Advancing stocks refers to total number of stocks within a market index that has increased in price over the last day. Declining stocks refers to the total number of stocks within a market index that has decreased in price over the last day. And finally, previous net advances refers to the net amount of advancing and declining stocks over the last day.
Let’s illustrate an example of the advance decline line. If the current advance decline line today is 75, and tomorrow there were 60 advancing stocks, and 40 declining stocks, then what would the ADL line reading be? Well, we would start by subtracting the declining stocks from the advancing stocks and then add to that the previous net advances. So, in this case the advancing stocks is 60, the declining stocks is 40, and the previous net advances is 75. So, 60-40+75 = 95. Thus, the new A/D line would register reading of 95.
Let’s look at another example. If the advance decline line today is 50, and tomorrow there are 40 advancing stocks, and 60 declining stocks, then what would be ADL line reading be? Again, we start off by subtracting the declining stocks from the advancing stocks and then add to that the previous net advances. Therefore, the advancing stocks is 40, the declining stocks is 60, and the previous net advances is 50. So, 40-60+50 = 30. As such, the new A/D line would register reading of 30.
A/D Line Interpretation
The A/D line tells us how much participation there is within an overall market advance or decline. When the A/D line is rising within the context of an uptrend in prices, this is an indication of widespread bullish participation among stocks. And similarly, when the A/D line is falling within the context of a downtrend in prices, this is an indication of widespread bearish participation among stocks.
Conversely, when the market is trending higher, however, the A/D line is not confirming, meaning that the A/D line is flat or moving lower, this can be a sign that a potential reversal may be nearing. Along the same lines, when the market is trending lower, and the A/D line is not confirming, and instead the A/D line is flat or moving higher, this can be a sign of a potential reversal in prices to come. This non-confirmation is often seen as bullish divergence during a downtrend, or a bearish divergence during an uptrend.
A healthy trend is said to exist when the price and A/D line are moving in the same direction. For example, when the advance decline line and the market index are both rising, then this is considered a bullish scenario. Similarly, when the advance decline line and the market index are both falling, then this is considered a bearish scenario. Essentially, in both of these scenarios the price action is being confirmed by the A/D line, meaning that there is broad participation, and thus a more reliable trend condition.
Advance Decline Line Signals
The advance decline line is best applied to a broad market index such as the Dow 30 or an exchange such as the New York Stock Exchange. It is a market breadth indicator that provides us insight into the health of a trend and the likelihood of its continuation or reversal. The A/D line is useful for all classes of traders including day traders, swing traders, and position traders. However, each of these class of traders will have a different application based on their holding periods.
There are two primary signals that the advance decline line provides. Firstly, traders can use the A/D line to confirm the strength of the trend. We touched upon this earlier but to recap, when the advance decline line is moving higher along with the price action, this is an indication of a healthy uptrend.
There is wide participation among stocks in the uptrend, and the expectation would be for continued price movement higher. And when the advance decline line moving lower in conjunction with the price action, this is an indication of a healthy downtrend. The expectation would be for continued price movement lower.
Below we can see an example of a Dow 30 price chart shown with the A/D line that is used to confirm the health of an existing price trend.
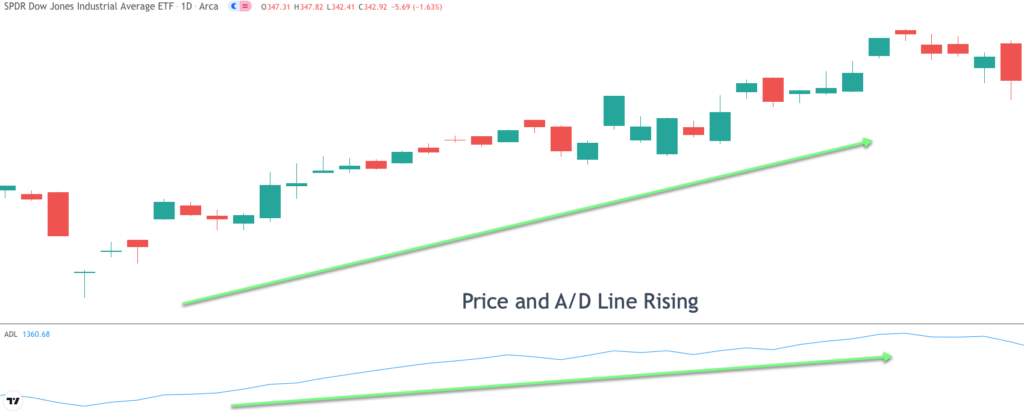
Notice how the price, and the Dow Jones advance decline line are moving in the same direction. Specifically, as the uptrend progresses, the A/D line confirms the price movement by rising as well. This suggests that there is widespread participation of stocks in this uptrend and that provides a level of confirmation for the price trend.
Secondly, traders can use the A/D line to locate potential reversal points. This is done using non-confirmation between price and the A/D line. More specifically, in the case of a potential reversal of an existing uptrend, we would look for the price action to be making higher highs, while the A/D line is making lower highs. This is referred to as a bearish divergence between price and the A/D line.
On the flipside, we can spot a potential reversal of an existing downtrend, by studying the price chart and looking at swing lows that are progressively lower, while the A/D line is making higher lows. This is referred to as a bullish divergence between price and the A/D line.
Below you can find an example of a Nasdaq 100 price chart shown with the A/D line that is used to spot non-confirmation between price and the A/D line.
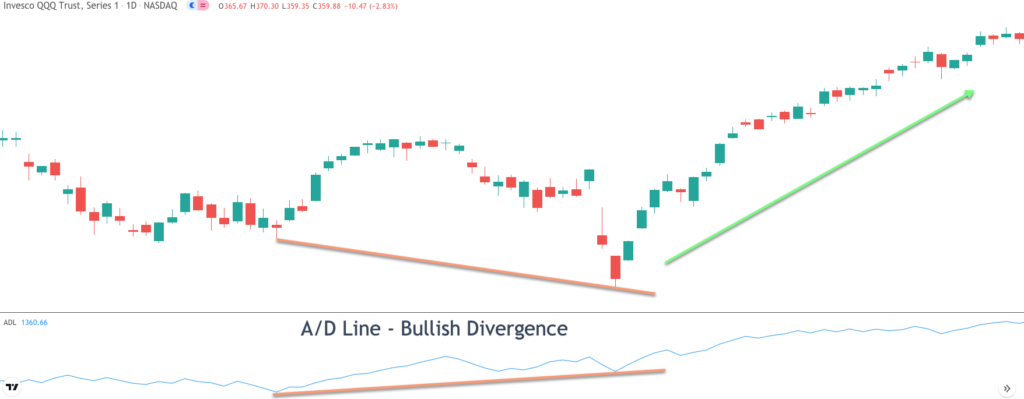
So, let’s discuss this NASDAQ advance decline line example.
Here we can see that the price action created two major swing lows wherein the second swing low is lower than the first swing low. Now at the same time, the advance decline line created a pattern wherein the reading at the low point of the second swing low was higher than the low point of the initial swing point. This creates non-confirmation in the form of a bullish divergence between the price and the advance decline line.
We will now move on to building a simple trading strategy that incorporates the advance decline line. Within this strategy we will be making use of three different technical trading tools. The first will be the advance decline line, the second will be a simple trendline, and finally we will be using the 21 day simple moving average line.
The idea behind the strategy is to locate potential reversal points on the price chart that can lead to a new price trend. This strategy has components of both a contrarian entry signal coupled with a trend following trade management technique.
This strategy is best implemented on a broad market index such as the NASDAQ 100, S&P 500, or Dow 30. Additionally, this A/D line strategy can also be used with a market exchange such as the NYSE. So, let’s get into the rules of this advance decline trading strategy now.
Below are the rules for entering into a long position.
- The price must be trading lower and exhibit a bearish tendency or trend.
- A bullish divergence must occur between the price action and the advance decline line.
- Upon spotting a bullish divergence pattern, a best fit bearish trend line should be drawn on the price chart.
- Wait for the price to break and close above the bearish trendline.
- Upon a valid break and close above the bearish trendline, enter a long position immediately at the start of the next candle.
- The stop loss should be placed below the low of the candle preceding the valid break out.
- The 21 day SMA will be used as the trailing stoploss mechanism. When price closes below the 21 day SMA the trade will be closed out.
Now here are the rules for entering into a short position.
- The price must be trading higher and exhibit a bullish tendency or trend.
- A bearish divergence must occur between the price action and the advance decline line.
- Upon spotting a bearish divergence pattern, a best fit bullish trend line should be drawn on the price char.
- Wait for the price to break and close below the bullish trendline.
- Upon a valid break and close below the bullish trendline, enter a short position immediately at the start of the next candle.
- The stop loss should be placed above the high of the candle preceding the valid break out.
- The 21 day SMA will be used as the trailing stoploss mechanism. When price closes above the 21 day SMA the trade will be closed out.
Nasdaq Advance Decline Line Example
Now that we have described the components of this A/D line strategy, let’s now take a look at a few examples to make the concepts more crystal clear in our mind. Below you will find the price chart of the NASDAQ 100 shown on the daily timeframe.
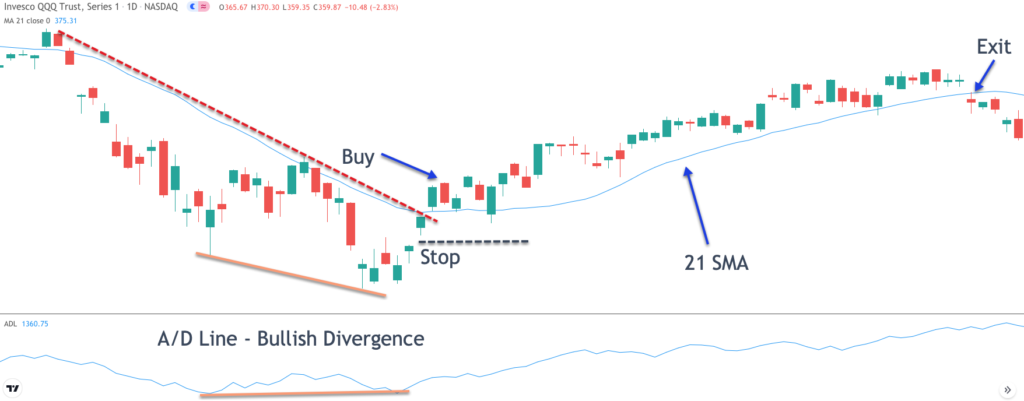
Within the price action you can see the blue line which represents the 21 day simple moving average. The red dotted line represents the bearish trend line. The orange lines shown on the price chart and the A/D line indicator represent the bullish divergence pattern.
Starting at the far left of the price chart, we can see that prices start to move lower and begin to carve out a bearish trend. Soon thereafter, we can see two major swings created within the price action.
The second swing low is lower than the initial swing low as can be seen by the down sloping orange line within the price action. During this time period, the advance decline line was making a higher swing low. This occurrence creates the bullish divergence pattern shown on the price chart.
Once these events have been recognized, we could prepare for a possible long entry into this market. But first, we would need to draw a bearish trend line that best fits within the context of this downtrend. You can see the down sloping red dashed line which represents the bearish trendline.
The entry to buy would occur upon a break and close above this bearish trendline. You can refer to the price chart once again to reference that buy entry point. The stoploss would be placed at the low of the candle preceding the breakout bar as shown by the black dashed line noted as, Stop.
At this point we would simply stay in the trade for as long as the price action stays above the 21 day simple moving average line which is shown in blue. Following our buy entry prices proceeded to move higher. But after some time, prices did begin to retrace lower, and we can see that a bearish gap occurred which closed below the 21 SMA line. This event would have served as our trade exit signal.
SP500 Advance Decline Line Example
Let’s now look at another example of the advance decline line indicator strategy. This time we will be referring to the daily price chart of the S&P 500 which can be seen in the image below.
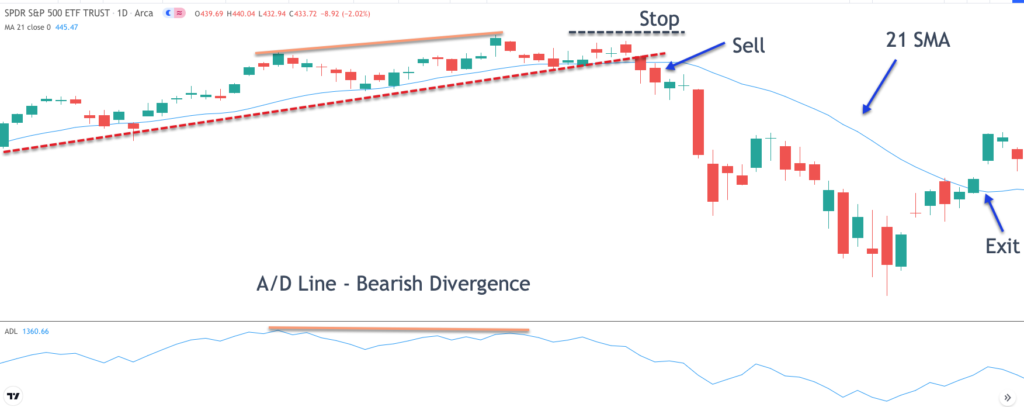
Notice here how the price begins trading higher in a stairstep fashion creating an up trending market scenario. We can see that a clear bearish divergence pattern formed between the price action and the S&P advance decline line. Notice the two orange lines wherein the prices are making higher highs, while the cumulative advance decline line is registering lower highs. This creates the bearish divergence condition required within this trade set up.
From here we would want to plot a best fit bullish trend line connecting the lows within the prior uptrend. You can reference this bullish trend line by looking at the red dashed line within the price action. The sell entry signal occurs when the price breaks below and closes below this upward sloping trendline. We would enter a market order to sell short immediately following the close of the breakout candle. The stoploss would be placed just above the high of the candle preceding the breakout bar as shown by the black dashed line noted as, Stop.
Once we’re in the trade, we will want to hold the position until a very specific event occurs. And that event would be the crossing and closing of price above the 21 SMA line. Immediately following our sell entry signal prices move lower quite rapidly creating two strong bearish price legs. After the second leg lower, prices began to consolidate a bit and then commenced to move higher. The trade was closed out based on our exit signal as can be seen by the blue arrow noted as, Exit.
Summary
The advance and decline line is an excellent breadth indicator that can provide us valuable insights into price movement within a major market index. The most reliable trading signal offered by the A/D line is the divergence signal. Whenever a bullish or bearish divergence signal occurs between the price action and the A/D line, traders should take notice. These events often lead to market reversals that can prove to be quite profitable.
The post Analyzing Market Breadth With The Advance Decline appeared first on Forex Training Group.