Submitted by Lance Roberts via RealInvestmentAdvice.com,
Since the November election of Donald Trump, the investing landscape has gone through a dramatic change of expectations with respect to economic growth, market valuations and particularly inflation. As I noted two weeks ago, there is currently “extreme positioning” in many areas which have historically suggested unhappy endings in the markets. To wit:
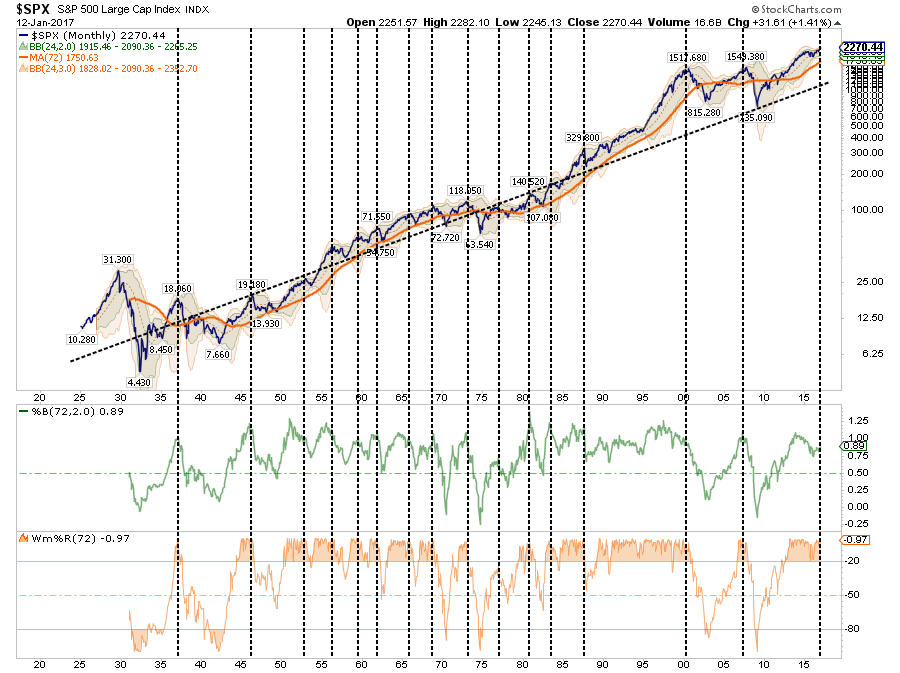
“Much like a ‘rubber band,’ prices can only be stretched so far before having to be relaxed to provide the ability to be stretched again.
The chart below shows the long-term trend in prices has compared to its underlying growth trend. The vertical dashed lines show the points where extreme overbought, extended conditions combined with extreme deviations in prices led to a mean-reverting event.”
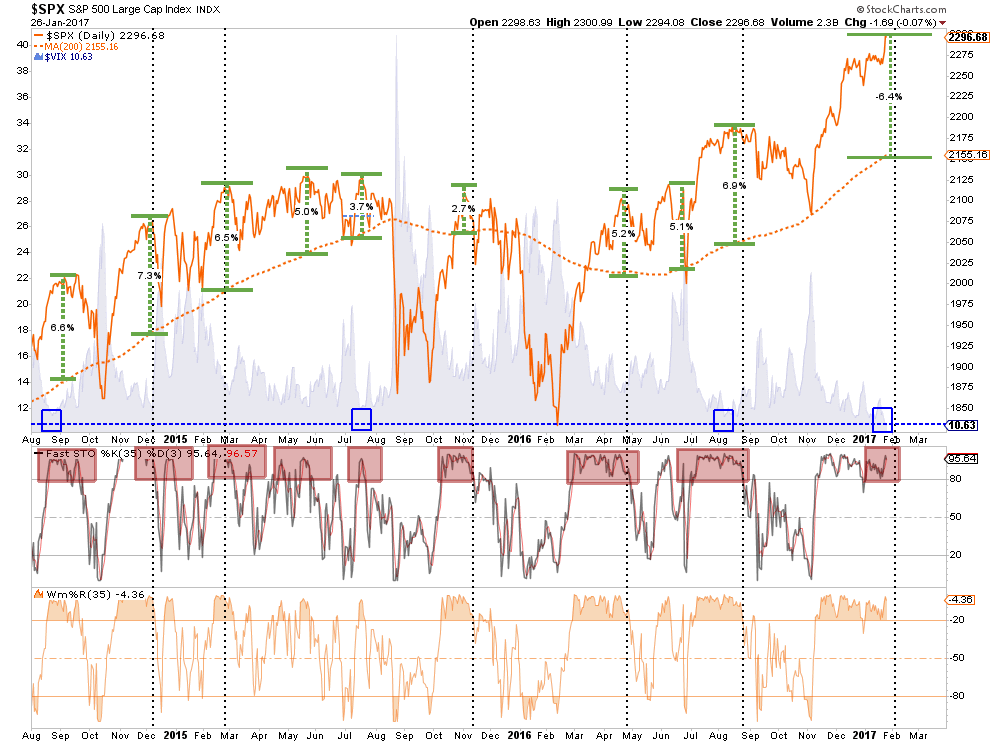
We can also witness the rather extreme extension of prices above the 200-dma. Such extensions, which are always combined with extreme overbought conditions, have typically not lasted long and have been a good indication to take profits in the short-term. This provides some opportunity to invest capital following a correction to some level of support.
Buy The Dip? Probably.
HedgEye had a good note on why the market keeps going up against what we would deem to be rational behavior:
“How does the rate of change of volatility (VIX) affect what’s getting “expensive” and “cheap”?
I think about that in terms of the volatility of volatility. It’s something you can readily measure and map with futures and options data.
Looking at the S&P 500’s (SPY) realized volatility, for example:
- 30-day realized volatility has been smashed to 6.6%
- But, at 8.7%, implied volatility is trading at +29.2% premium
- On a TTM z-score that implied volatility premium is +0.44x”

“So that keeps telling me that the highest probability outcome remains for lower-highs and lower-lows in VIX.
And that keeps happening in a US Equity market that is often called “expensive” (it is), but doesn’t get cheaper. Maybe someone from the orthodoxy of macro “valuation” experts can chime in on why this is happening.
I think it’s because consensus continues to position for a correction that would be deemed “rational”, as opposed to buying all dips in an irrationally profitable position that’s been complimented by prevailing growth and inflation conditions.
Can the U.S. stock market get more expensive? Absolutely.”
A “buyable correction” would suggest a correction back to recent support levels that keep the overall “bullish trend” intact.
The chart below shows the recent advance of the market has gotten to extremely overbought conditions on a short-term basis and the ‘sell signal’ noted at the top of the chart, combined with the extreme overbought condition at the bottom, suggest a potential correction could take the market back to 2200. Also, note the negative divergence of the PMO oscillator despite the advance in the market.
While such a correction would be relatively minor in the short-term, it would also violate the bullish uptrend that has held since the 2016 lows.
However, putting this into an actual loss perspective, the following chart details specific support levels back to the psychological level of 2000. A violation of the 2000 level and we are going to start discussing the potential for a more severe market correction.
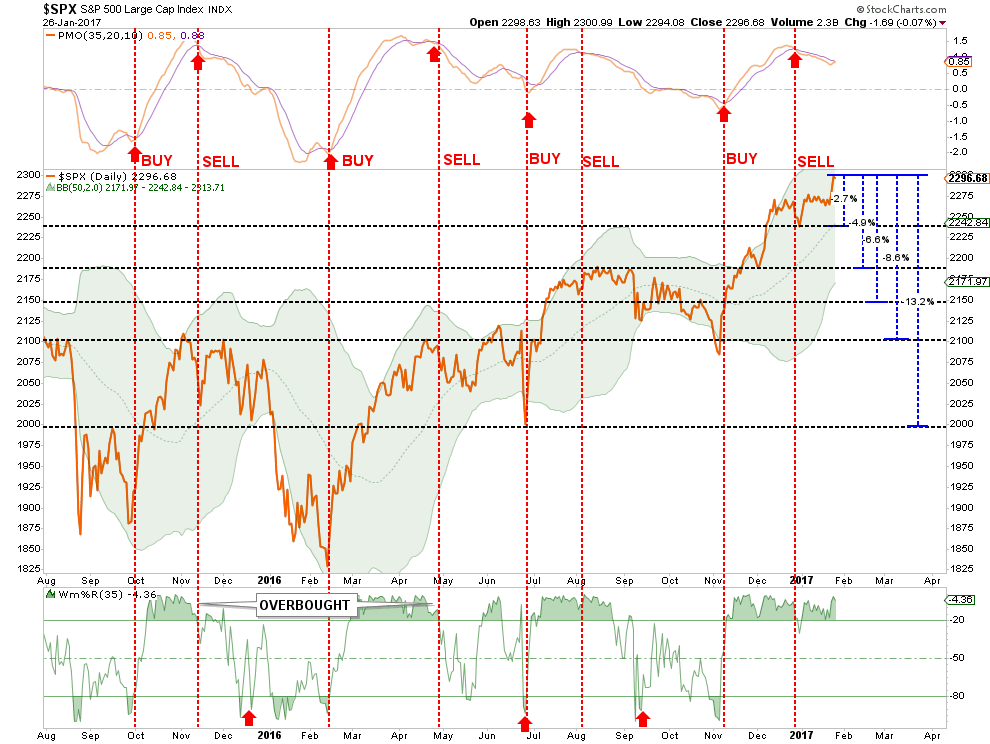
A violation of initial support level sets up corrections of 4.9%, 6.6%, 8.6% and 13.2% from the recent highs. With bullishness running at highs, and cash allocations at lows, the risk of a short-term reversal is high.
However, I am certainly not discounting the short-term ability for the markets to move higher as discussed in “2400 or Bust!.” This is particularly the case if fiscal policy is actually implemented, earnings improve more than expected or additional monetary policy is introduced. But it is the risk of loss that currently outweighs the reward.
However, there is another more extreme view that was put out by Matrix Trade yesterday:
“For the last seven years, we have tracked both the DJIA and SPX with very similar bull markets in both 1929 and its copy 1987 {made famous by Paul Tudor Jones using very similar technology for arguably one of the greatest trades of all time}. The US markets have now entered the last but most aggressive phase of the uptrend where sentiment takes over and where perma-bears give up all hope. They are now finally right in principle but not timing nor extent”

“We had wondered what would trigger such aggressive strength and volatility… until November 9th, 2016 when Donald Trump was elected. The subsequent change in the market dynamic not only provides the reasons for this move but also provides a very clear date from which to countdown very similar blowouts. As we have target areas for both percentage and a timeline to count up or down and indeed different indices to compare we will continue to monitor the price action exactly in line with these famous historic blowouts and crashes. Good Luck !”
Like a dealer at a poker table enticing players into a game:
“Step right up, place your bets and take your chances.”
Another Reason Not To Sell Bonds…Yet
As I penned last weekend:
“If the market corrects, OR the economy hits a speed bump, OR something happens in the Eurozone, OR…OR…OR…the covering of short positions in bonds will cause an extremely fast drop in yields.
Sure, anything can happen. If yields on the 10-year Treasury break above 3% it will be coincident with a sharp rise in consumer spending, wages, inflationary pressures that are broad based and surging economic growth. In such a case it will make sense to reduce bond holdings in favor of equities.
However, given the fact we are already in the 3rd longest economic expansion in history, combined with the second highest levels of valuation on stocks, the odds of such an outcome are extremely low.”
But here is another reason to stay long bonds.
Currently, as noted by ZeroHedge on Friday:
“With political and economic policy uncertainty at record highs and equity market valuations near record highs, we have one question: which market – interest rates or stocks – is right about ‘risk’ ahead?”
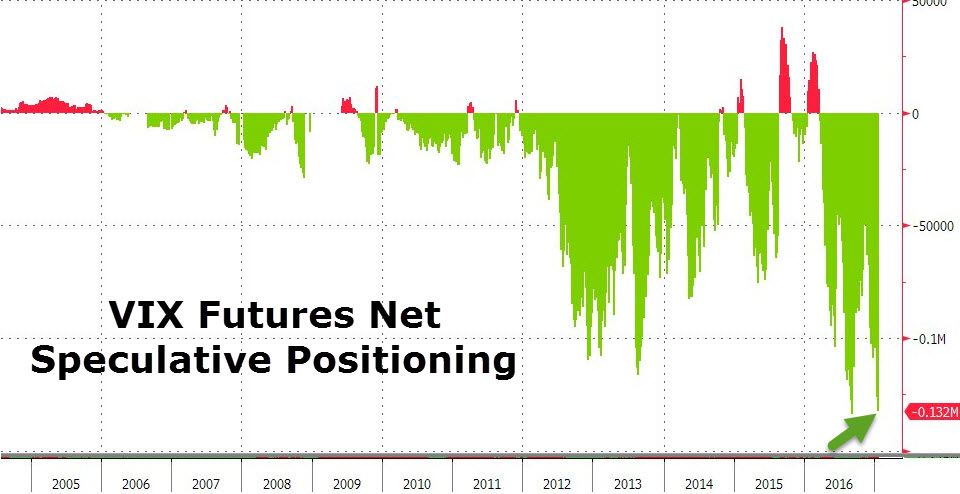
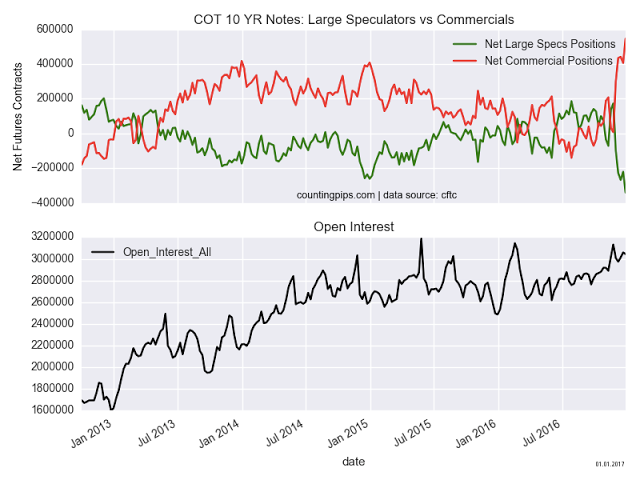
Currently, there are record shorts on volatility which suggest there is little expectation of a market correction currently. In other words, everyone is now on the long-side of the proverbial “boat.”
So, why own bonds?
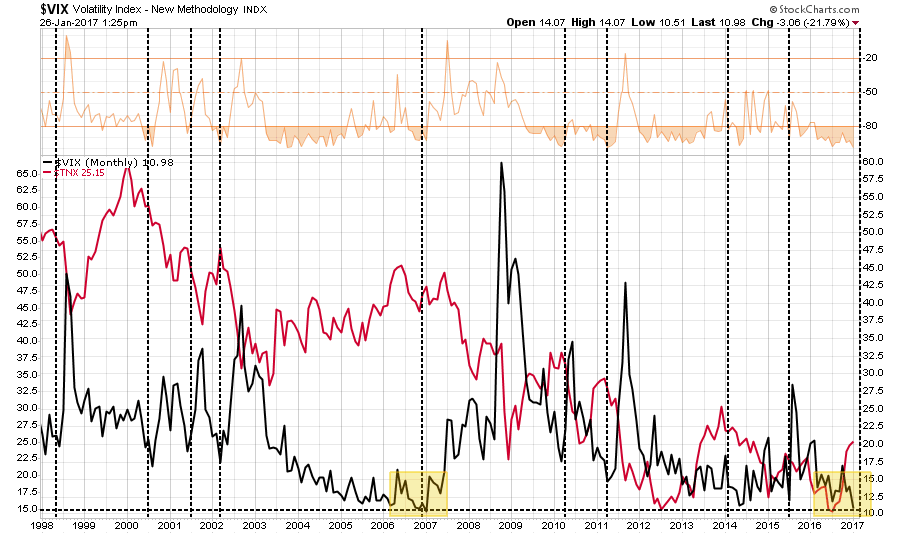
As shown in the chart below, interest rates are negatively correlated to the volatility index. With the extreme net short positioning in bonds, a market correction would spark a rotation from “risk” to “safety” pushing rates towards 2%. However, such a reversal would also trigger a panic-driven short-covering trade which would likely push rates even lower towards 1.5%.
That thought was also discussed recently at the Macro Man blog:
“We still think that Mr. Bond will have a soft landing this time. In fact, now that the Inaugural is behind us, with all of its ‘Sound and Fury signifying nothing’, Mr. Market will likely undertake a more cerebral evaluation of the likelihood of 4, 5 and 6% US GDP in 2017.
A renewed safe haven bid for Mr. Bond and other fixed income assets seems certain before long, as Real Money and commercials have increased their net longs. The speculative community remains extremely short bonds, providing a mechanism to accelerate any recovery in fixed income once it gathers speed, eventually forcing a surprising number of concealed shorts to return to a more neutral positioning in Treasuries.”
Currently, we remain long bonds as a hedge until the abnormalities are reversed.

The post Another Reason Not To Sell Bonds…Yet appeared first on crude-oil.top.