Disappointing trade data from China this morning saw Asia equities marked lower with a knock-on weaker USD in the G10 space.
China’s trade data showed exports falling to their lowest levels in six months this morning. Import growth also missed to the downside, both in USD and CNY terms.
10:00 *(CN) CHINA SEPT TRADE BALANCE (USD): $42.0B (6-month low) V $53.0BE;
Trade Balance (CNY): 278.4B (6-month low) v 364.5Be –
Exports Y/Y: -10.0% v -3.3%e; biggest decline in 7 months- Imports Y/Y: -1.9% v 0.6%e
Yuan Terms-Trade Balance (CNY): 278.4B v 364.5Be- Exports Y/Y: -5.6% v +2.5%e- Imports Y/Y: 2.2% v 5.5%e
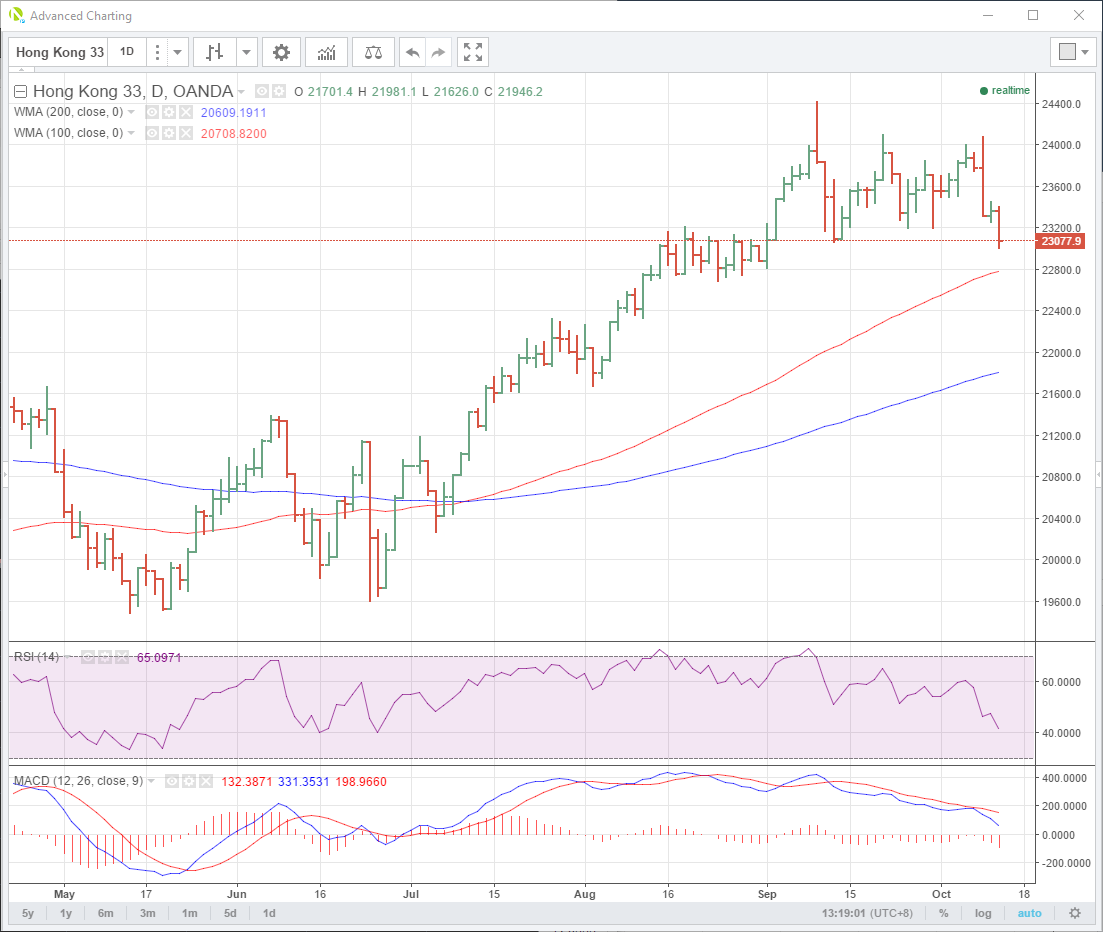
The Hang Seng responded by immediately falling 1.5% breaking support at 23180. Daily support lies in the 22775 area, the 100-day moving average and an area of previous daily low congestion.
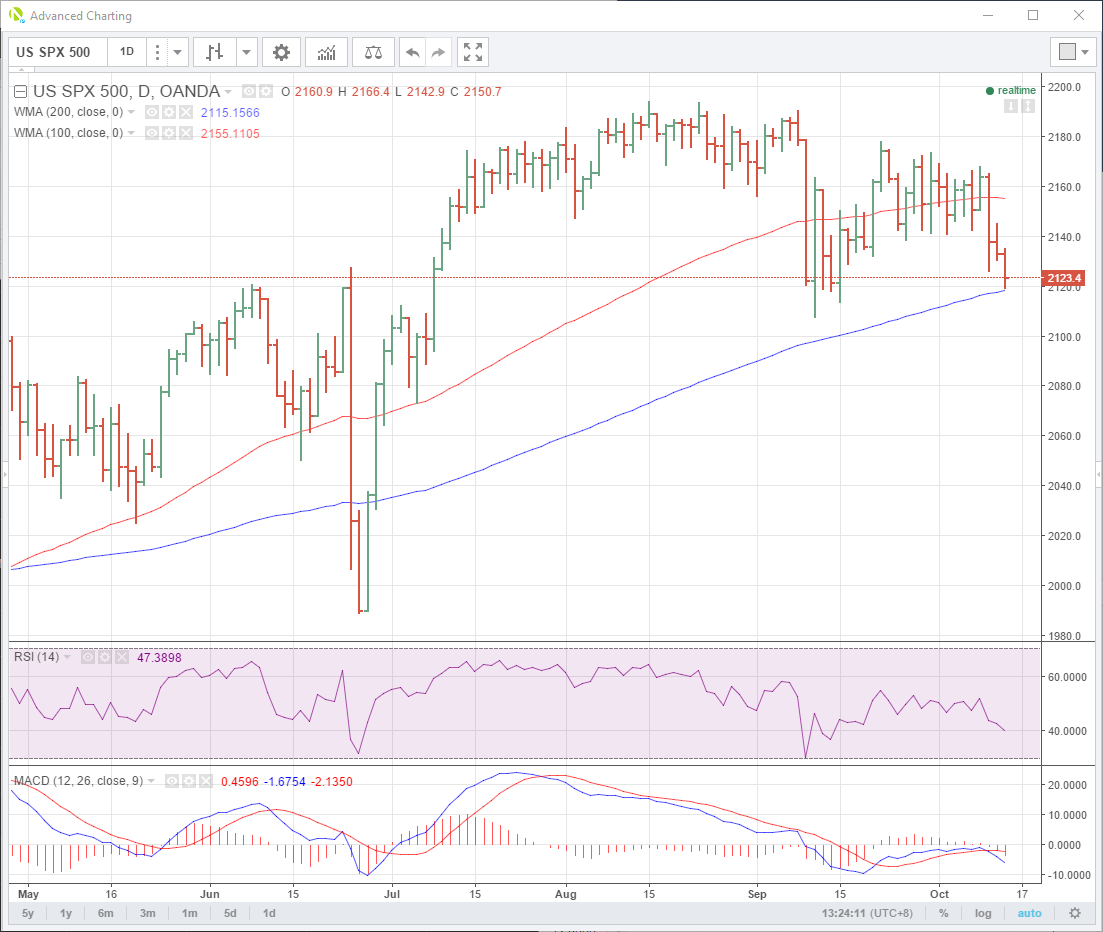
SPX500
The S&P followed suit, selling off 15 handles in double quick time. This also flowed into general short-term USD selling.
The index sits ominously now just above the 200-day moving average at 2118 with a previous daily low at 2107 the next support level.
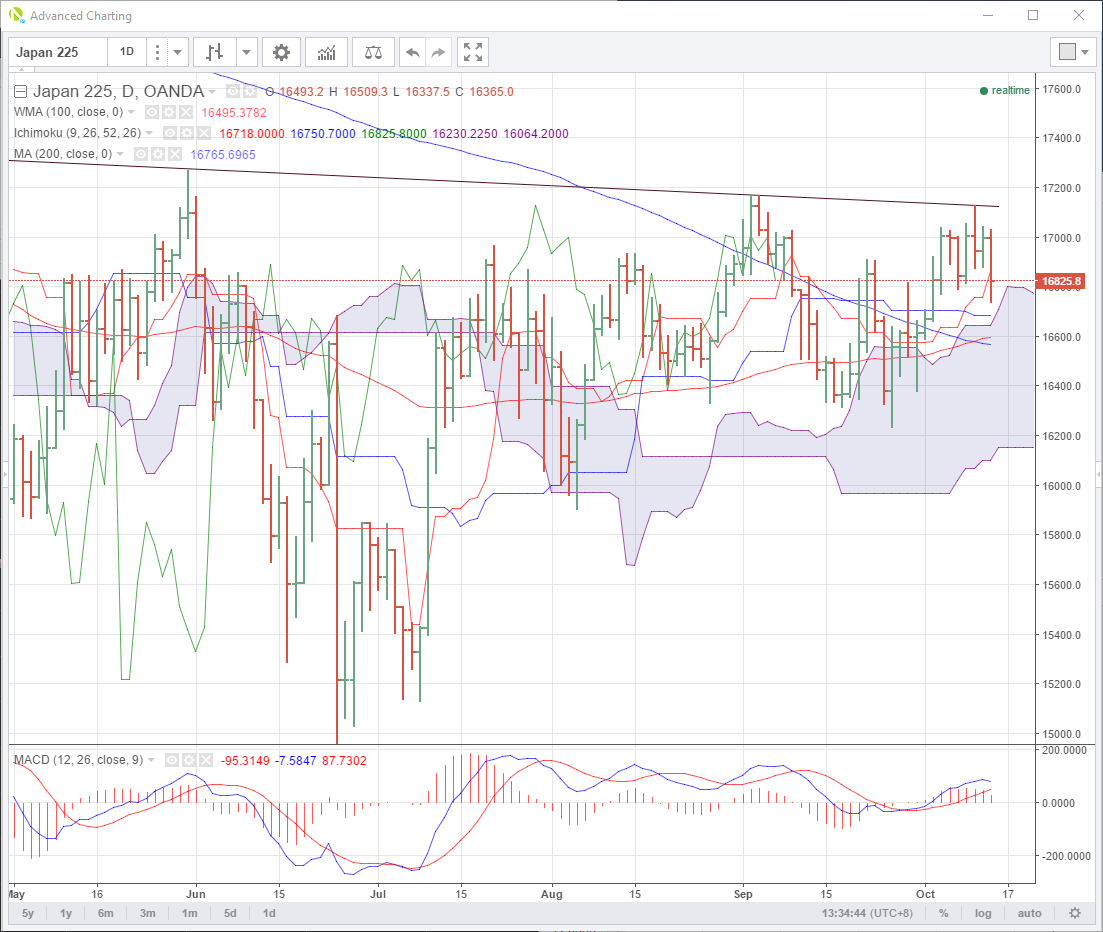
Nikkei
Followed the Hang Seng’s lead falling 0.8%. The daily chart is quite compelling with trendline resistance at 17120 having held nicely a couple of days ago.
The rather messy chart shows an import support region below. 16775 the top of the Ichi moko cloud and 16565/16595 containing the 100 and 200-day moving averages. The MACD momentum indicator looks like it is also getting ready to cross downwards.
USDJPY
Where goeth the Nikkei goes the USD/JPY. Bulls showing no appetite to wear any pain. Having bought USD/JPY to two-month highs at 104.60 at the start of the session, they wasted no time selling it down just as quickly as the nikkei fell. Support lies at 103.50 with resistance at 104.60.
EUR/USD
EUR/USD couldn’t sustain its 40 point bounce with resistance at 1.1045 holding to settle at the low end of its range around 1.1015. This implies the move is more short term in nature, confined to high beta currencies to China headlines and Asia stocks.
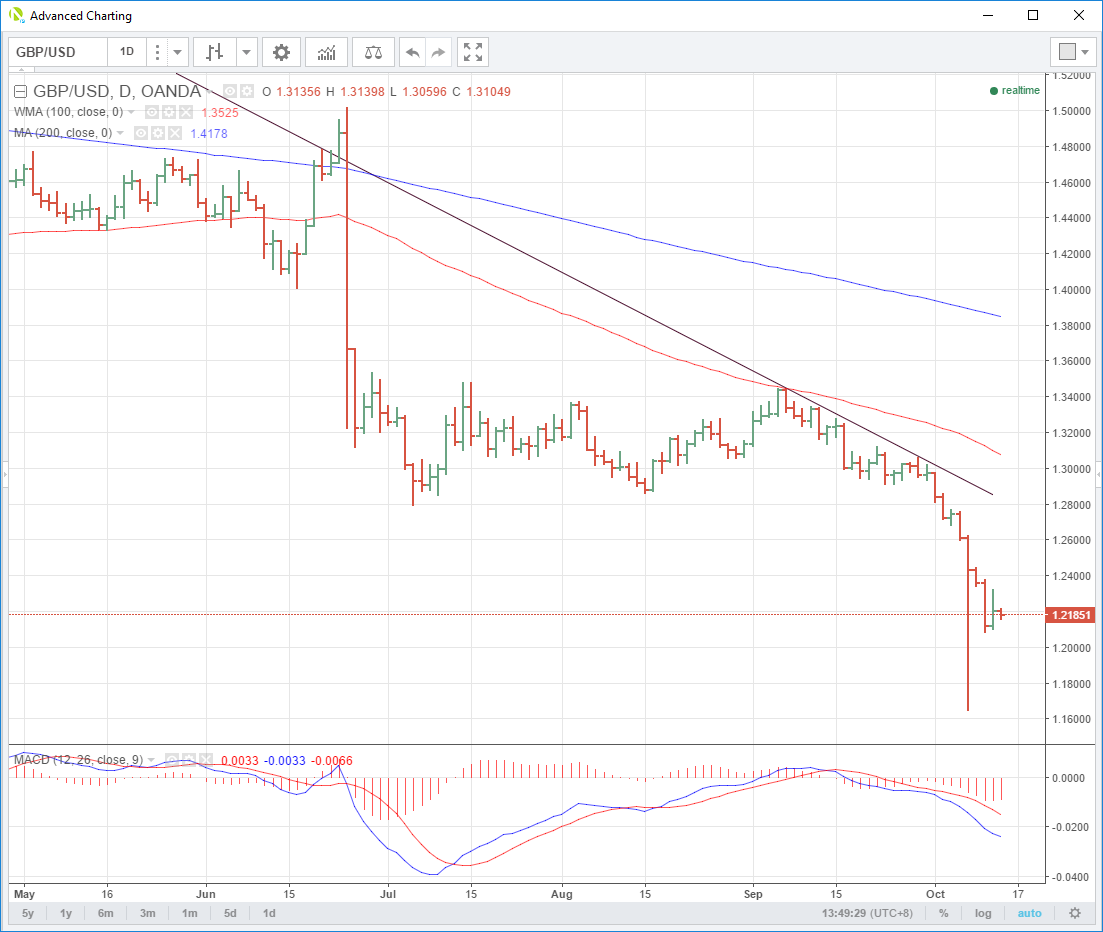
GBP/USD
Continues to march to its own beat. The Theresa May inspired rally of yesterday quickly fading away with GBPUSD sitting at 1.2183. Despite all the noise made about extreme short positioning etc etc etc the chart shows that GBP is still solidly in a downtrend. It will off course be subject to “headline bombs” but the chart looks pretty clear. There is no sign of life from the MACD either.
Critical support lies at 1.2080/1.2100 post flash-crash lows.
USD/ZAR
Speaking of headline driven currencies. USD/ZAR had another one of those nights. Following on a massive move higher Tuesday driven by the arrest warrant of the Finance Minister, see APAC Corner: GBP Jumps While ZAR Crashes, overnight the prosecutor has said he is prepared to review the entire fiasco. The result has been predictable…
USD/ZAR fell 30 big figures from 14.5000 to 14.2000 before settling mid “range” at 14.3000. USD/ZAR has resistance here at 14.3370 the daily Ichi moko cloud top with support at 14.1200 the bottom of the daily cloud.
Summary
China data surprises continue to move high beta stock indices in the absence of other news. This has a selective knock-on to equally high beta currencies such as the JPY. Other pairs continue to be driven by “headline bombs” keeping traders on their toes.