For just the 2nd time in 10 years, both stocks AND bonds are hitting 3-month lows.
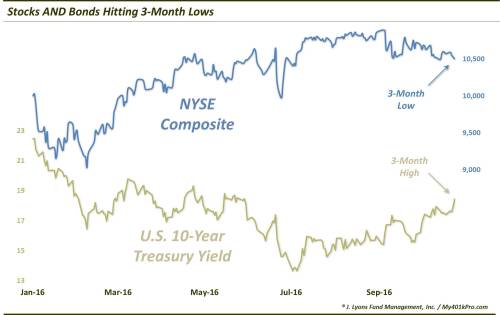
This week, stocks began to exhibit some of the weakness of which our models suggested they were at risk. It hasn’t been manifested in the large-cap averages as much yet as they continue to hold within their recent months-long range. However, as we covered this week, small-caps and mid-caps have each exhibited potentially significant breakdowns. And another broad index that we can add to that list is the NYSE Composite. In early October, it broke its post-February Up trendline, softening up its rally support. And today, we see the index breaking below its September-October lows to set a 3 and a half-month low.
If we switch asset classes, we see an odd thing about this new low in stocks. Jumping to the bond market, we see that yields, specifically the 10-year Treasury yield, are hitting 5-month highs. Now, as bond prices move opposite yields, it strikes us as odd that bonds would also be hitting multi-month lows along with stocks. In recent years, bonds have been a reliable haven in the midst of stock weakness. To see both assets at new lows is certainly a change of character for the market.
So this development is different. But is it bad different? Well, certainly if one has a balanced portfolio of stocks and bonds, it is bad different at the moment. But is it a bad different signal going forward? And for which asset class?
Intuitively, it would strike us as a red flag for the bond market since stock market weakness in recent years has been a reliable buoy for bonds. Thus, this change of character would seem to reflect the bond market more so than stocks. And the fact that bonds have dropped in the face of stock market struggles would seem to bode poorly for the bond market.
But if you know us at all, you know that “intuitively” is not a sufficient investment strategy to us. We prefer a quantitative, measurable approach. Thus, let’s take a historical look at other times that saw stocks and bonds hitting 3-month lows at the same time. As it turns out, since 1965, there have been just 34 such prior unique occurrences, encompassing 118 days. This is just the 2nd occurrence in 11 years (June 24, 2013).
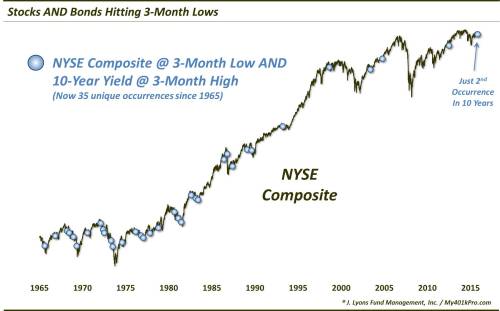
As yields were on an inexorable rise until 1981, it should be no surprise that 19 of the 34 unique occurrences, and 78 of the 118 days, occurred prior to 1982. The phenomenon has been much less frequent during the post-1981 secular bull market in bonds, particularly recently. Just 4 other occurrences, and 7 total days, occurred within the past 20 years. So this is indeed a rare development.
But what about the implications, if any? Looking at the prior occurrences, we do see a slight tendency for below-average performance in stocks and bonds in the short-term following such occurrences.
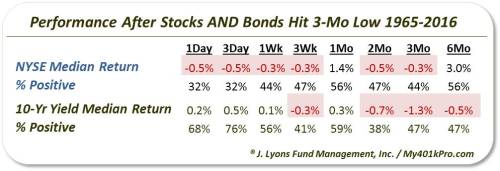
Median returns in the NYSE were negative over almost every period from 1 day through 3 months. The first few days were especially weak with stocks advancing just one third of the time. Bond yields tended to continue their rise up through a month later. After that, they tended to give back their gains.
Returning to stocks, looking more closely, much of the weak tendency following these events can be traced to the earlier portion of the look-back period. For example, in the short-term, 18 of the 22 occurrences prior to 1984 saw negative 2-day returns. Bonds also saw losses 2 days later 17 out of 18 times prior to 1981. Looking further out, 13 of the 15 events prior to 1978 saw negative 3-month returns in the NYSE. That’s not a shock considering the mid-60′s to mid-70′s saw a handful of brutal bear markets in stocks (and bonds, for that matter).
More recently, returns have not been as consistently negative. In fact, the last 4 occurrences (in August 1999, May 2004, October 2005 and June 2013) all generally saw gains from 1 week to 1 year later. This recent trend certainly deserves to be weighed a bit more heavily than events occurring 50 years ago (though the market cycle may turn out to be not too dissimilar than that of the mid-60′s-early 70′s)
On balance, it is difficult to use this prior evidence to construct a reasonable bullish or bearish argument for either stocks or bonds following their coincident 3-month lows. The preponderance of events saw weakness afterward, but the most recent events did not. Thus, we have a hard time leaning either way based on this signal. But, as hard as we might try, we can’t seem to shake our intuitive feeling that this is more of a negative signal for bonds than anything else.
At a minimum, let’s just say that if this trend continues, all stock and bond investors are going to be pretty disappointed.
* * *
More from Dana Lyons, JLFMI and My401kPro.

The post ‘Balanced’ Investors Stuck Between A Rock & A Hard Place appeared first on crude-oil.top.