Weaker-than-expected China growth in the third quarter has raised questions about the global demand outlook, with most commodities adopting a softer bias.
Energy
CRUDE OIL prices fell for a second straight week last week, with WTI touching the lowest level since September 18, after China’s Q3 GDP growth numbers disappointed. The 200-day moving average at $67.60 remains intact, with prices trading above this average since August 16. Prices have not managed a close below it in more than a year. The spread between WTI and Brent is still hovering above the 10-pip mark and has been pivoting around 10 this month. WTI is currently trading at $69.41.
WTI Daily Chart
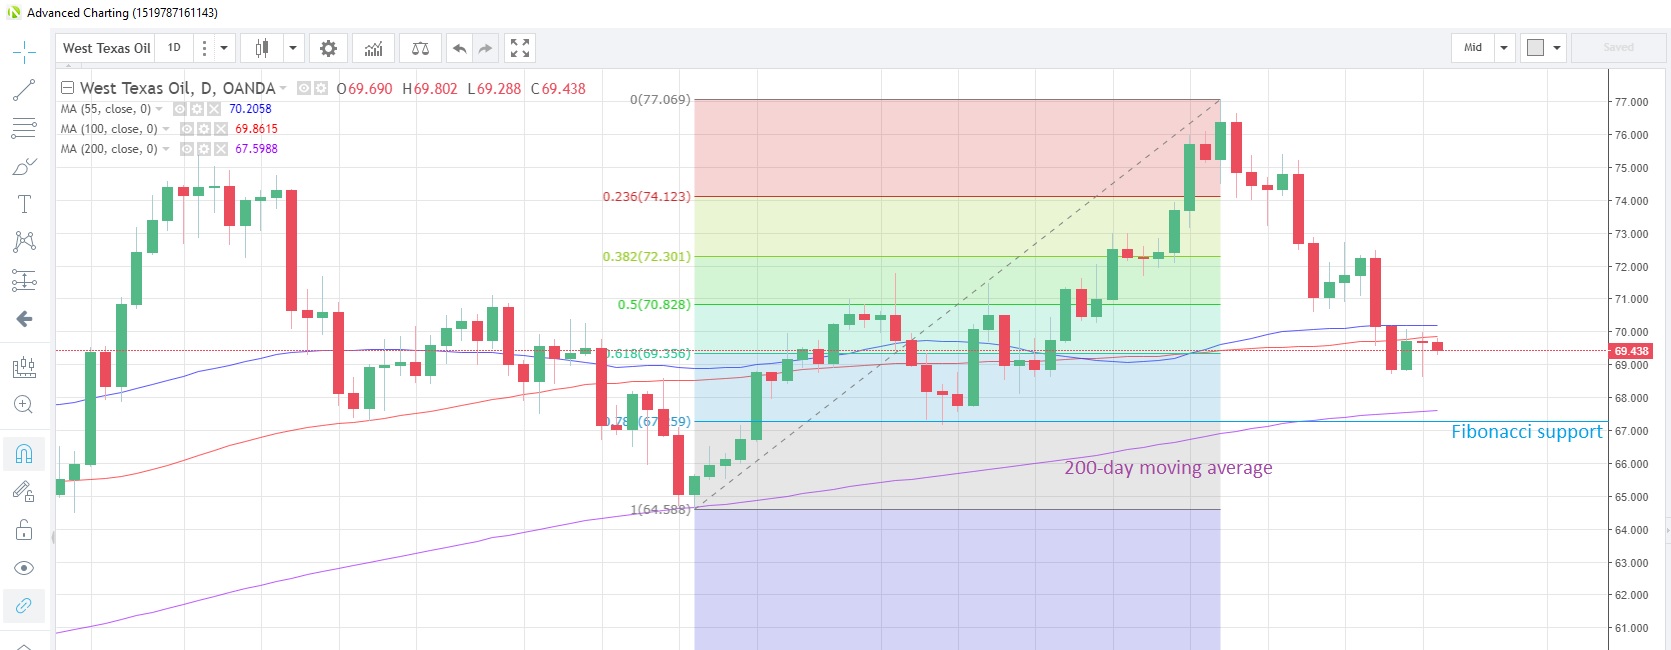
Source: Oanda fxTrade
As relationship strains increased between the US and Saudi Arabia following the mysterious death of journalist Jamal Khashoggi, Saudi’s Energy Minister assured markets that his country has no intention of unleashing a 1973-style oil embargo on Western consumers, but instead was focused on raising output to counter production shortfalls elsewhere. Saudi currently produces 10.7 million barrels per day (bpd) and has the capacity to increase to 12 million bpd, he added.
Weather continues to determine NATURAL GAS’s near-term direction. The forecast for mild weather across Central US pulled gas prices down to two-week lows and they are testing the 38.2% Fibonacci retracement of the rally from September 10 to October 9 at 3.145.
Japan announced that it had committed $4 billion from the public and private sectors since last year to support Liquefied Natural Gas supply chain projects. Through the financial support, Japan targets to expand global LNG market capacity by 50 million tons per year.
Precious metals
GOLD rallied for a third straight week last week, the longest series of weekly gains since January. The metal has been oscillating around the 100-day moving average, at 1,224 today, for the past seven sessions, stuck in a 1,215 to 1,235 corridor since October 12. It’s now at 1,223.48. Speculative accounts shifted their positioning to net long for the first time in 10 weeks, the latest snapshot of CFTC data as at October 16 shows.
SILVER positioning by speculative accounts remains bearish, but has been trimmed to the lowest level since August 21. Silver has managed to close above the 55-day moving average for the past three sessions and may be attempting to build a base above it. Silver is currently trading at 14.543 with the 55-day moving average at the same level.
PLATINUM has been on a downward track since the release of the China GDP data last Friday. The metal looks set for its second day of declines after touching the lowest in almost two weeks yesterday. The 55-day moving average at 810.08 lends support to prices. Speculative accounts increased their net long positions to the highest since April 24, the latest CFTC data shows.
South Africa, the world’s largest producer of platinum, announced last week that the country’s mining production in August fell by the most in 2-1/2 years, according to Statistics South Africa.
PALLADIUM surged to its strongest in nine months yesterday, posting the biggest one-day gain in more than two months, amid rumors that the US plans to pull out of a landmark nuclear weapons agreement with Russia, as Trump believes Russia has been violating the pact. Russia is one of the largest producers of palladium, and heightened tensions between the two countries could disrupt supply at a time when demand is tight.
Hedge funds have reportedly also been building long positions, and this saw net longs rise to their highest since June, the latest CFTC data shows. The metal has its eyes on the January high of 1,140 and is currently sitting at 1,119.64, after climbing for the past three weeks.
Base metals
COPPER remains within the parameters of both the 100- and 55-day moving averages. The 100-day moving average sits on top at 2.7917 and has capped prices on a closing basis for the last six months. On the other hand, the 55-day moving average at 2.7009 is acting as support, with prices closing above it since September 17. Copper is now at 2.7548.
China announced Q3 GDP growth of 6.5% y/y on Friday, and this caused a knee-jerk reaction lower for copper due to slower growth’s impact on the metal’s demand. The drop proved to be short-lived however, as the 55-day moving average held. China’s Statistics Bureau announced that the country’s copper output in September increased 10.4% y/y.
In related industrial metal news, Ford Motor Company complained Monday that Trump’s tariffs were making steel more expensive in the US than anywhere else, reducing their ability to compete in the global market.
Agriculturals
WHEAT prices failed to overcome the 55-day moving average last week and have retreated to the lowest level in eleven days. The 55-day moving average is at 5.078 today while the 200-day moving average offers support below at 4.838. Wheat is currently flat on the day at 4.959.
Wheat Daily Chart

Source: Oanda fxTrade
There has been mixed news on the supply side for wheat during the last week, with Canada announcing last Friday that wheat production in the 12 months to end-July was estimated to be 7% higher than the previous forecast. Meanwhile down in Australia, drought conditions are affecting crops, with production to end-September estimated to be down to 18 million tons from 21.3 million tons a year ago, a drop of almost 15.5%, according to USDA Foreign Agricultural Service estimates.
SUGAR climbed to its highest level in seven months this morning and is currently poised for its biggest monthly gain since June 2016. Recent reports suggest that Thailand’s sugar exports may drop 40-50% next year due to government plans to use more sugarcane in the biochemical industry locally.
Bloomberg reports that money managers trimmed their bearish net short positions by 51,763 contracts to 36,289. That’s the lowest net short position in 16 weeks. Rabobank mentioned in a research note that sugar is firmer amid concerns that Indian exports will not surpass four million tons.
Sugar Monthly Chart
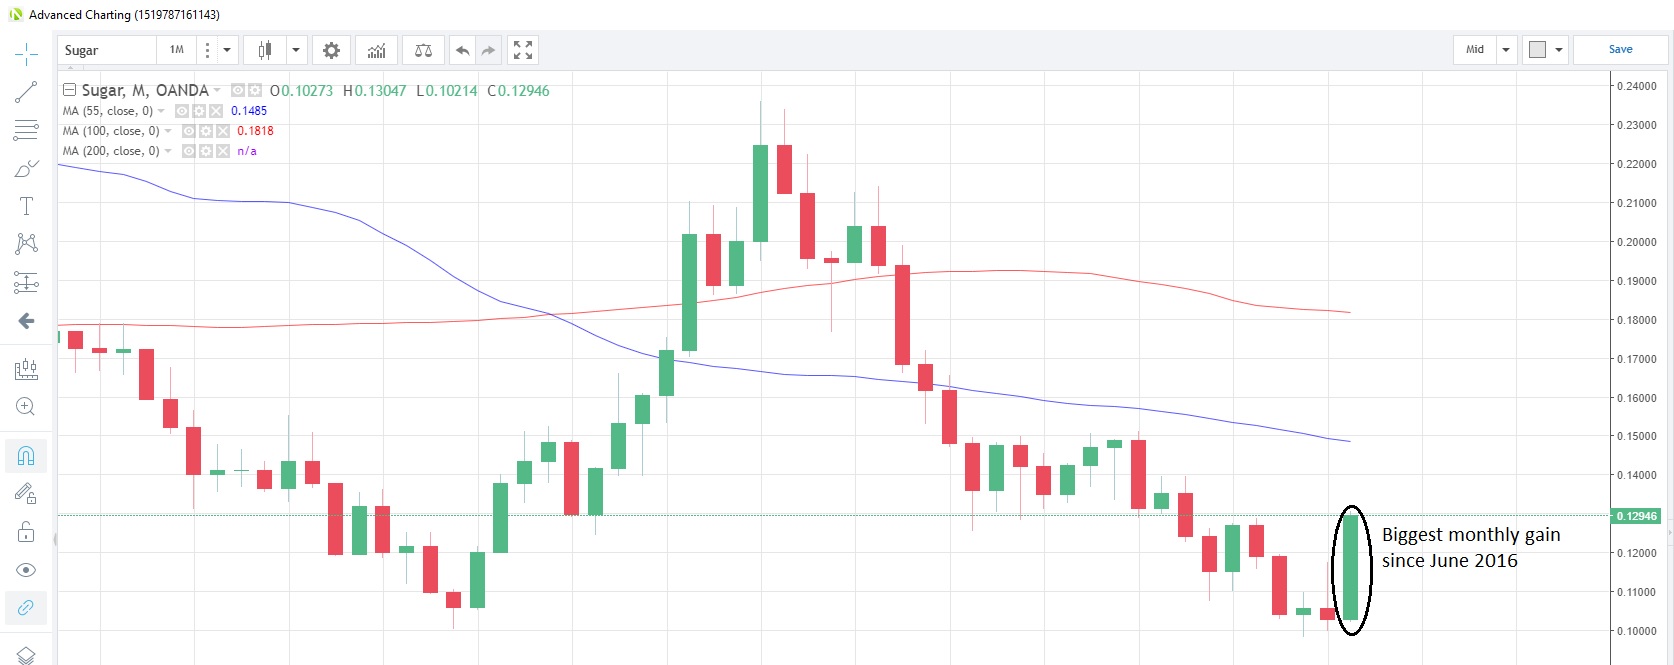
Source: Oanda fxTrade
CORN is consolidating near the 200-day moving average at 3.6257 after falling last week for the first time in five weeks. Favorable weather in the US is helping farmers to catch up on harvests, with reports suggesting Ohio is 47% harvested, Illinois 82% and Indiana 67% completed. The EU has also raised its 2018 crop yield forecast by 1.9% from the prior estimate.
In contrast, the SOYBEANS harvest does not appear to be going so well, with crop yields lower than expected in parts of the US Midwest. Prices are holding above the 55-day moving average at 8.4897, which has supported prices since October 11. Soybeans are now trading at 8.518.
A report from Purdue University has estimated that the US could lose up to 9 million acres of soybeans to Brazil in the long-term, if the US-China trade war escalates further to a worst-case scenario.