Friday was quite volatile in terms of price action for GBP/USD, but the pair managed to stay inside the narrow channel established between the 200 SMA at H1 chart and the demand zone of 1.2123. The overall scenario remains bearish and it’s possible to see a downside continuation during this week and a confirmation of that should be a breakout below the January 11st session.
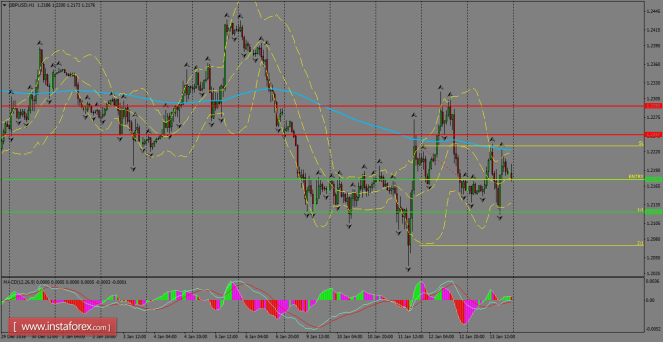
H1 chart’s resistance levels: 1.2247 / 1.2293
H1 chart’s support levels: 1.2175 / 1.2123
Trading recommendations for today: Based on the H1 chart, sell (short) orders only if the GBP/USD pair breaks a bearish candlestick; the support level is at 1.2175, take profit is at 1.2123 and stop loss is at 1.2228.
The material has been provided by InstaForex Company – www.instaforex.com
The post Daily analysis of GBP/USD for January 16, 2017 appeared first on forex-analytics.press.