America’s Rolling LBO
In effect, America has undergone a rolling national LBO since the Gipper’s time in office. It is the result of the Washington/Wall Street policy consensus in favor of permanent deficit finance, stock market-centered “trickle-down” stimulus by the Fed and massive borrowing by the household and business sectors of the private economy.
So the U.S. economy is now stuck in the ditch because it has leveraged itself to the hilt over the past three decades. The vast majority of Americans are no longer living the dream because Wall Street speculators and Washington politicians alike have led them into a debt-fueled fantasy world that is coming to a dead end.
Indeed, this deformation has been long in the making and reaches back nearly a half-century. To wit, once the Federal Reserve was liberated from the yoke of Bretton Woods and the redeemability of dollars for gold by Nixon’s folly at Camp David in August 1971, financial history broke into an altogether new channel.
As shown in the chart below, since 1971 total public and private debt outstanding soared from $1.6 trillion to $64 trillion or by 40X. By contrast, nominal GDP expanded by only 16X. The very visage of the chart tells you that the former is crushing the latter.

These debt numbers are elephantine in their own right, but the real surge began when Greenspan took office in August 1987. Shortly thereafter in response to the infamous 25% stock market crash of October 1987, the purported financial Maestro launched the nation’s central bank down the road of chronic easy money and massive monetary intrusion in the financial markets.
The fruit of that wrong-headed monetary path is straight forward. There was just $11 trillion of total credit market debt—–government, household, business and finance—–outstanding at the time Greenspan discovered the printing presses in the basement of the Eccles Building. That small mountain of debt has grown by a staggering $53 trillion during the years since then.
That five-fold debt gain in less than a generation represents a radical discontinuity from the past history of American capitalism. For more than a century after U.S. industrialization really took-off during the 1870s, in fact, the ratio of total public and private debt to national income held steady at about 150%. And that was true with only slight variations during periods of boom and bust, as well as war and peace.
That modest amount of economy-wide leverage might well be considered the Golden Mean. During the century ending in 1970, the US standard of living rose 20-fold and the nation’s economy grew like nothing before it in the history of the planet.
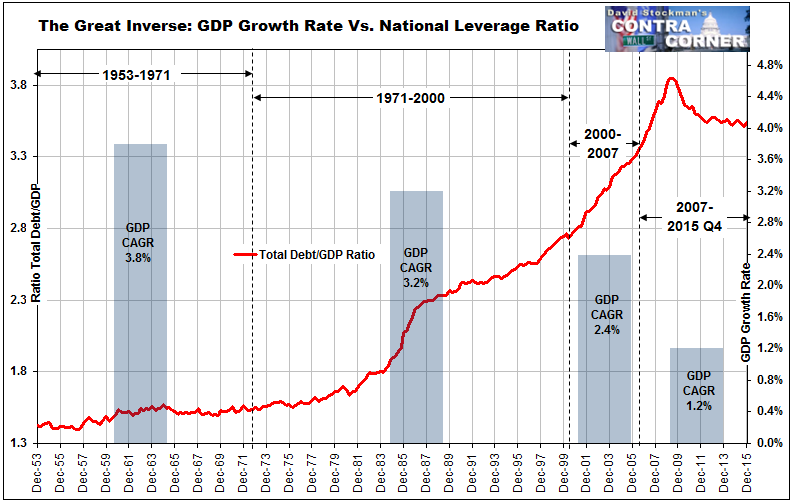
No longer. As shown in the chart below, the trend rate of real GDP growth has dropped by a stunning 70% since the national LBO gathered steam after 1980.
At the same time, the national leverage ratio went nearly parabolic during the years before the financial crisis and now stands at 350% of GDP. This means the US economy is currently lugging around two more full turns of debt relative to national income than it did historically.
Those extra turns amount to a staggering $35 trillion more debt today than would have been the case if the Golden Mean of 150% of national income had not been abandoned after the 1970s.
During the rising phase of this debt eruption, of course, the US economy had a quite a party. During the 1990s and for a time prior to 2007 these massive borrowings goosed consumption spending in the household sector and fixed asset investment in business.
But then the due bill of debt service costs arrived. Already during the Greenspan housing boom-and-bust cycle (2001-2008), real GDP growth had slowed sharply from 3.8% per annum during the heyday of 1953-1971 to just 2.4% per annum.
Since the great financial crisis, however, the toll has dramatically intensified. During the nine years since the last peak in December 2007, real national output has crawled forward at just 1.2% per annum. That is barely three-tenths of its growth rate recorded during 1953-1971.
Needless to say, the mainstream narrative amounts to a studied attempt to obfuscate the dramatic seven decade-long southward journey depicted in the gray bars of the chart below. That’s because the political, financial and media elites who shape the news and public dialogue are essentially anti-historical incrementalists.
They operate from headlines and short-term deltas. They boast about the gains from last month and last quarter, but never explain or take accountability for the periodic financial and economic collapses which have sharply lowered average or trend rates of economic growth and living standard gains since 1987.
Worse still, the elite narrative bamboozles the public with recency bias. You would never know that the startling uphill climb depicted in the red line of the chart even happened.
Nor do the talking heads of Wall Street or the spokesmen and apologists for the Fed ever acknowledge that the current 3.5X ratio of debt to income is an unprecedented and dangerous departure from the 1.5X historic norm. Yet the latter stalwart feature of the financial system was still firmly in place as recently as 1971.
Needless to say, even as the above chart captures the sweeping deterioration that has beset the nation’s economic fundamentals, that outcome is not due to some inherent flaw of capitalism. The above baleful development is the modern state at work; it’s the product of the elite consensus about money printing, financialization, perpetual Washington stimulus and bailouts and the cult of the stock market.
Not surprisingly, the same media and group think commentariat that was utterly surprised and shocked by the rise of Trump and Bernie has no clue either about the nation’s debilitating LBO and the reverse Robin Hood redistribution that it has foisted upon the American economy.
Much of the elites actually think that the Obama’s ballyhooed 78 straight months of jobs growth and high stock markets is evidence that the U.S. economy has been fixed, and that the chilling financial crisis of 2008 was just some aberrational bump in the road.
No it wasn’t. The meltdown of 2008 was just spring training for what comes next.
The purpose of this book, therefore, is to debunk these establishment fairy-tales, and to thereby explain the deep economic predicate for the rise of Donald Trump in particular and the growing anti-establishment sentiments of the American public generally.
Equally importantly, it aims to document the extent and the causes of the financial and economic rot that has descended on the US economy, and to provide a fundamental roadmap for its amelioration.
As we indicated, the only real cure possible at this late hour is a drastic national U-turn back to free markets, fiscal rectitude, sound money, personal liberty and decentralization of a minimalist state. These are unlikely choices for a “strong leadership” insurgent like Donald Trump who often seems to believe that America’s crisis has been caused by bad deals rather than bad ideas.
Still, a nation responding to insurgents like Trump and Bernie Sanders has hope. The policies of the existing elites have irretrievably failed because they embody the conceit that societal progress and welfare depend on keeping their own purportedly gifted hands firmly on the machinery of the state.
So if Trump now reaches the White House, at least the architects of America’s ruinous policy-inflicted LBO will find themselves pounding the pavement in search of a new line of work.

The post David Stockman Warns “2008 Was Just Spring-Training For What Comes Next” appeared first on crude-oil.top.