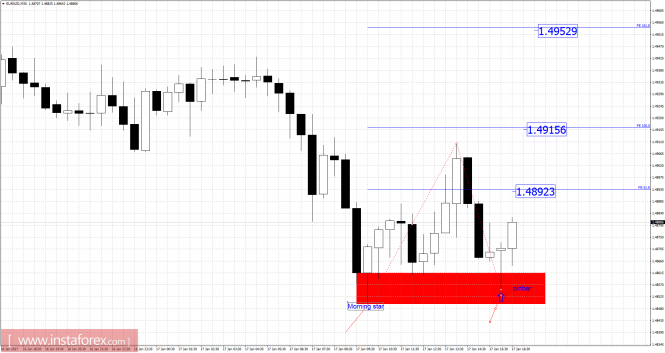
Recently, EUR/NZD has been moving downward. The price tested the level of 1.4849 in a high volume. I found a fake breakout of the support, which is a sign of strength. According to the 30M time frame, I found bullish candle formation (morning star) and later on a pin bar, which are signs of potential strength. The trend is still downward, but I expect the price to correct on the upside. My upward targets are set at the prices of 1.4982, 1.4915, and 1.4950.
Fibonacci Pivot Points:
Resistance levels
R1: 1.4960
R2: 1.4980
R3: 1.5020
Support levels:
S1: 1.4880
S2: 1.4860
S3: 1.4820
Trading recommendations for today: Watch for potential buying opportunities.
The material has been provided by InstaForex Company – www.instaforex.com
The post EUR/NZD analysis for January 17, 2017 appeared first on forex-analytics.press.