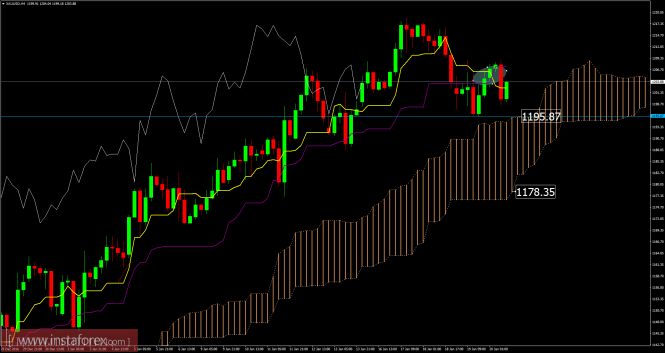
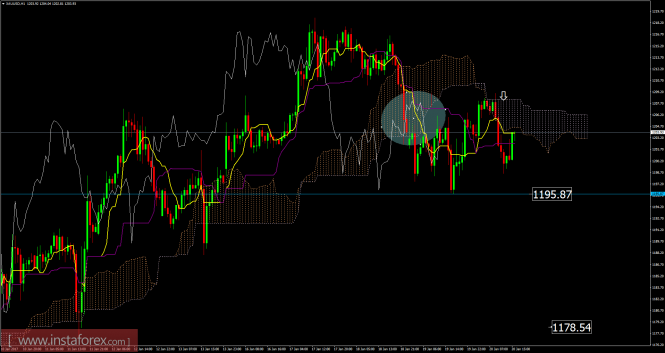
Recently, gold has been trading sideways at the price of $1,203.00. In the 4H time frame and using the Ichimoku cloud, I found that there is potential space for a downward correction. I found cross Tenkan sen-Kijun sen which is a sign for potential weakness and it is weak sell signal on 4H time frame. Anyway, according to the 1H time frame, I found that price has broken the Ichimoku cloud for downside, which is also a sign of weakness. Pay attention on downward levels at $1,195.85 and $1,178.55. Watch for potential selling opportunities.
Resistance levels:
R1: 1,203.35
R2: 1,205.30
R3: 1,208.45
Support levels:
S1: 1,197.10
S2: 1,195.15
S3: 1,192.05
Trading recommendations for today: Watch for selling opportunities.
The material has been provided by InstaForex Company – www.instaforex.com
The post Gold analysis for January 20, 2017 appeared first on forex-analytics.press.