Assets in bearish mutual funds just dropped to the lowest level since the onset of the August 2015 market rout.
One way to measure potential risk in the stock market is via sentiment, i.e., the level of investor bullishness, bearishness, etc. There are countless sentiment indicators in existence, but 2 main types, surveys and real-money indicators. Surveys are just that, surveys of a particular group of investors regarding their view toward the stock market’s prospects. And while various surveys have been helpful throughout the years, they are not always reliable as people may say one thing but act in a contrary manner. In other words, they don’t always put their money where their mouth is. That is why we prefer real-money gauges of sentiment, i.e., what investors are actually doing with their capital. Money talks and what investors are actually doing with their money talks louder than what they say they are doing.
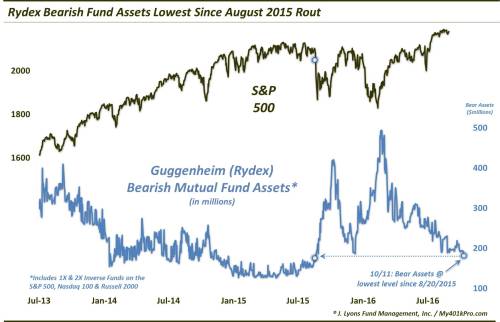
That brings us to today’s Chart Of The Day. There are a few surveys out there that point to very subdued investor sentiment of late. It is an interesting phenomenon considering the fact that major stock averages have remained relatively close to their respective 52-week, or all-time, highs for several months. This would seem to represent the proverbial “wall of worry” that stocks like to use as a climbing aid. However, we’re not so sure this read is reliable. That’s because other, real-money, indicators do not necessarily corroborate this story. One such metric is the amount of assets in inverse, or bearish, mutual funds, such as those offered by Guggenheim (formerly Rydex).
Rydex funds are geared toward more active or tactical traders. Therefore, tracking the level of assets in their funds can provide a glimpse into the prevailing investor sentiment among the group. Rydex provides the level of assets in their mutual funds on a daily basis so it makes this easy to track. Interestingly, and contradictory to some of the subdued survey readings, on Tuesday, October 11, the level of Rydex bearish fund assets dropped to the lowest level since August 20, 2015. Of course, that was during the onset of a nasty plunge in the stock market. (FYI, this calculation is based on a select number of the most popular Rydex inverse funds that we track. It is not a comprehensive tally and may differ from other vendors.)
It is important to remember that sentiment analysis is not always flashing a signal. Most of the time, sentiment is neutral, or only leaning slightly in one direction or the other. When it reaches an extreme, i.e., overly bullish or bearish, it can provide valuable information about the potential risk in the market.
Another way we like to monitor sentiment is to track its reaction to price behavior. For instance, how do investors react in the wake of sharp price rises and drops? We posted examples of this last February and in October 2015. In both instances, the stock market had just bounced sharply for roughly a week following devastating declines. But instead of rushing to exit the bear funds, Rydex traders poured substantial amounts of money into the bear funds – during the rally. This was a sign that traders were still concerned about the recent decline and skeptical toward the sharp bounce. As it turns out, the market would climb that wall of worry both times as it pressed higher in the early stages of substantial intermediate-term rallies.
Presently, we have a different, though not entirely opposite, dynamic. Over the past month, the stock market has experienced some turbulance, including in early September and early this week. And while this “weakness” hasn’t been significant by traditional historical standards, compared to the placid run-up since early July, it would qualify as relative weakness. So how have Rydex traders reacted? As the chart demonstrates, they’ve reacted by dumping their Bear funds – to the point where assets in such funds are the lowest since August 2015.
Our assessment of this development is that Rydex traders are quite complacent and unconcerned about imminent market weakness. From a contrarian basis, this is a negative for stocks, in our view, and represents an elevated level of potential risk. One reason is that, if more selling does occur, these traders are ill-prepared, position-wise, to withstand many losses before they feel the pain. That low level of hedging could, lead them to increase their selling or hedging in search of protection during the selloff. In turn, that selling can lead to an acceleration of market losses.
A few issues we’ll quickly touch on surrounding this data point. Last August when Bear assets were last at current levels, they were on the rise, unlike now as they are on the decline. That suggests that these assets certainly could go lower. Moreover, they can stay lower for a time. That is a valid point. There is nothing special about the present level of assets, except that they are lower than any point since last August.
However, a key point is that they are still going down. This is a valuable sign that traders are indeed complacent, despite the recent (albeit moderate) selling pressure. At least last August, traders had already begun to ramp up their hedges. That process has not even begun in this case. If there is indeed more selling pressure to come (which we think is likely), these assets will need to rise significantly before any bullish sentiment readings are given off.
Another issue which folks may raise, and which is also valid, is that mutual fund assets, as a whole, are in a structural decline. This is true and has been the trend since ETF’s exploded on the scene about a decade ago. However, again, that is a longer-term structural issue. In the shorter-term, there is still plenty of room for sizable swings in asset levels depending on the market’s behavior. Witness the selloffs last summer and early 2016 when these Bear assets increased by threefold. Thus, despite the structural decline, there is plenty of room in the shorter-term for effective sentiment signals to be generated.
And presently, based on our read of the situation, bearish fund traders appear to be in hibernation. This is a potential negative for stocks in the short to intermediate-term and could lead to an acceleration of any forthcoming selling that may unfold.
* * *
More from Dana Lyons, JLFMI and My401kPro.

The post “Most-Hated Rally Ever?” – Bear Fund Traders Go Into Hibernation appeared first on crude-oil.top.