The New Zealand Dollar has had a difficult end to the week. Being heavily sold against most of its major counterparts. However, the longer term charts and underlying macro situation mean the picture is not as clear-cut as it seems.
New Zealand has been somewhat of a darling recently. A purring economy, an excellent rugby team and some of the highest interest rates in the developed world keeping the New Zealand Dollar in demand.
The later is the most important in our zero percent interest rate world, and this has benefited both Aud and NZD.
Neither the RBA nor the RBNZ have been particularly happy about this and were no doubt hoping that the Federal Reserve would help them out (as did just about every other central bank), by finally delivering a rate hike.
To digress a moment, in New Zealand, we have a saying. “Like a possum in the headlights.” Meaning confused, disorientated or indecisive. The FOMC sadly did not hike, continuing to be the equivalent of a monetary possum in the headlights. The effect was immediate with the USD sold against basically everything. No doubt provoking much hand-wringing at RBNZ Head Quarters.
The NZD duly staged impressive rallies, not just against the USD, but a slew of other currencies we shall deal with below. The RBNZ has attempted to limit the damage on their Trade Weighted Index forecasts by being very dovish in their MPC announcements yesterday. Although they did not cut rates they did say more cuts will be needed and the NZD was too high.
As the dust settled in New York last night and Asia today, the USD has gradually eked back its losses helped by better than expected US Initial Jobless Claims. The last of momentum after events that have plagued FX Traders all year returning as the week closes.
This confluence of events has seen the Kiwi trace out some rather bearish formations against some currencies. Including some outside reversals. This may, however, not tell the whole story. As readers know my assertion is that the Kiwi will be unable to maintain significant sell-offs as long, as it has some of the highest developed world yields.
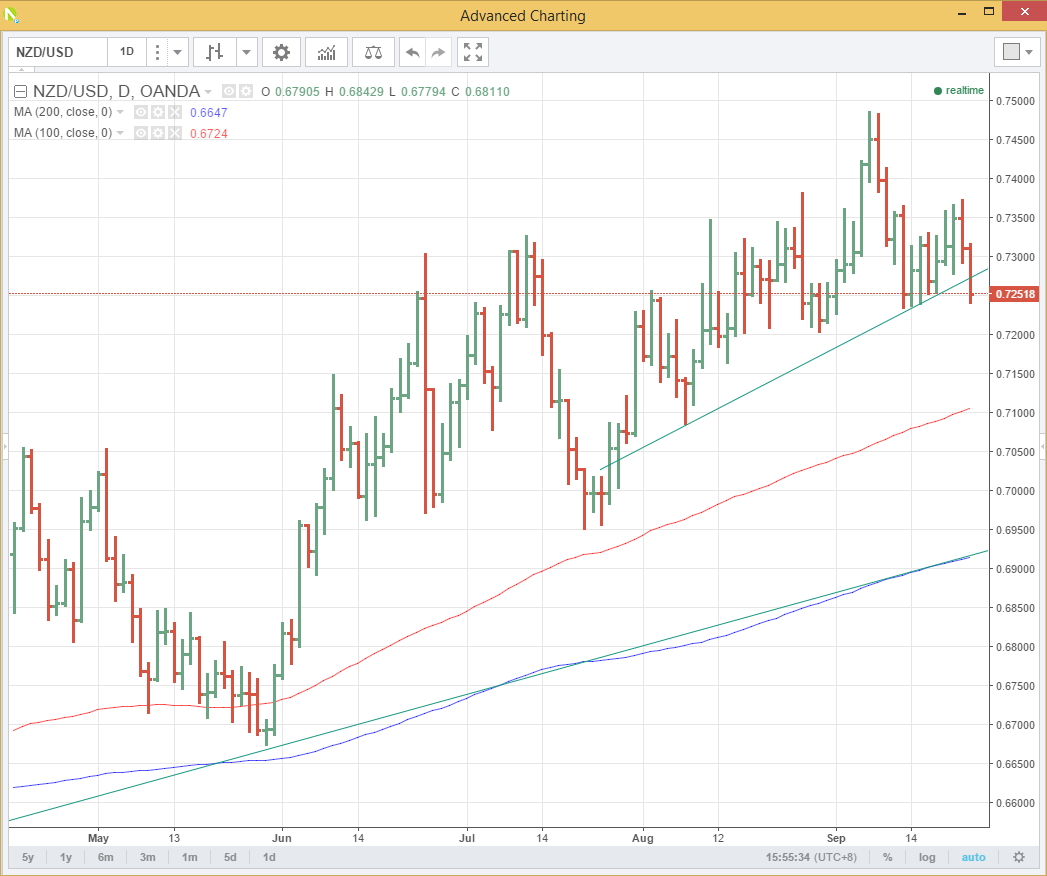
NZD/USD
The NZD has well and truly broken its trendline support on the daily chart at 7270. Support lies at 7235 and then 7200. A break under here opens up a move to the 100 day moving average (DMA) at 7105.
Resistance is at 7315 and then 7370.
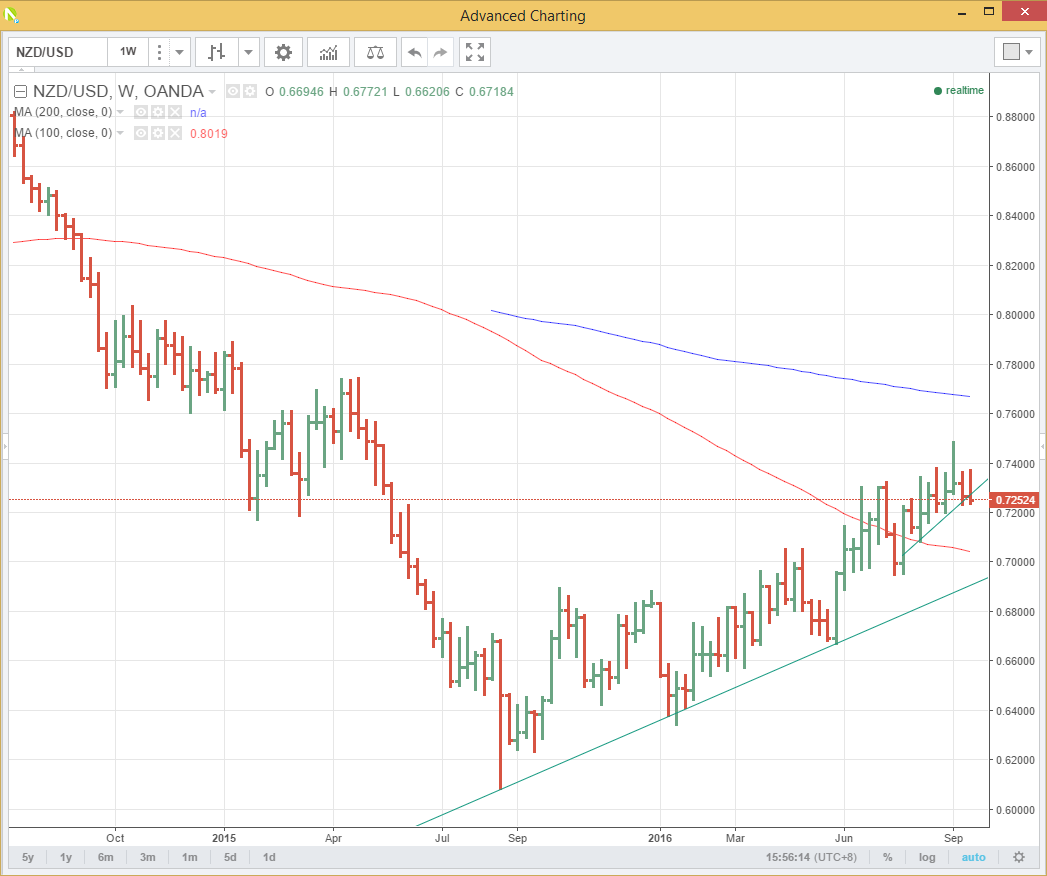
The picture is different on the weekly chart. A slew of long term support lies below. At 7044 the 200 week moving average (WMA). 6940 a weekly double bottom and then weekly trendline support at 6900/10 region.
NZD/JPY
No arguments here. The NZDJPY made an outside reversal day here on the FOMC. (made new highs and then closed much lower than the previous day.) Resistance is at 74.02 previous daily lows and the post FOMC breakdown. Above there at 75.00. Meaningful support does not appear until 75.15 a double bottom.
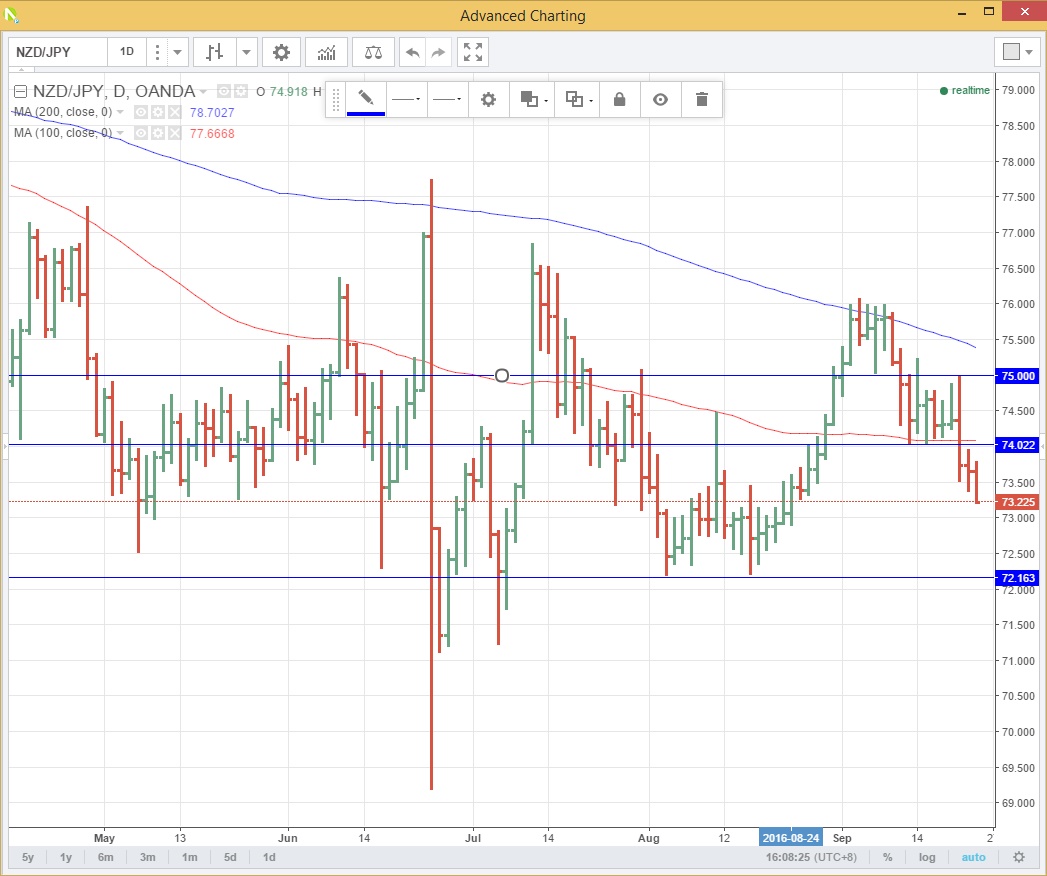
This crosses’ fate will be determined by whether USD/JPY holds at 100.00 and then 99.00. Certainly, chart-wise there is room to test lower from here. In the big picture, it will depend on your view of the Japanese authorities ability to stop USD/JPY dropping into a new 90/100 trading range. Here is a central bank with bigger issues on its plate than the RBNZ.
GBP/NZD
The daily chart is suggesting that suggesting this week’s price action has left the GBP/NZD snuggly tucked up in its recent 1.7650/1.8350 trading range.

The weekly chart tells a different story. Technically GBP/NZD is in a consolidating triangle formation of a very clear downtrend. Substantial resistance from the triangle apex sits around 1.8200. Support in the 1.7550/1.7600 is forming the base. A weekly close through here suggesting the next leg of the downtrend is underway.

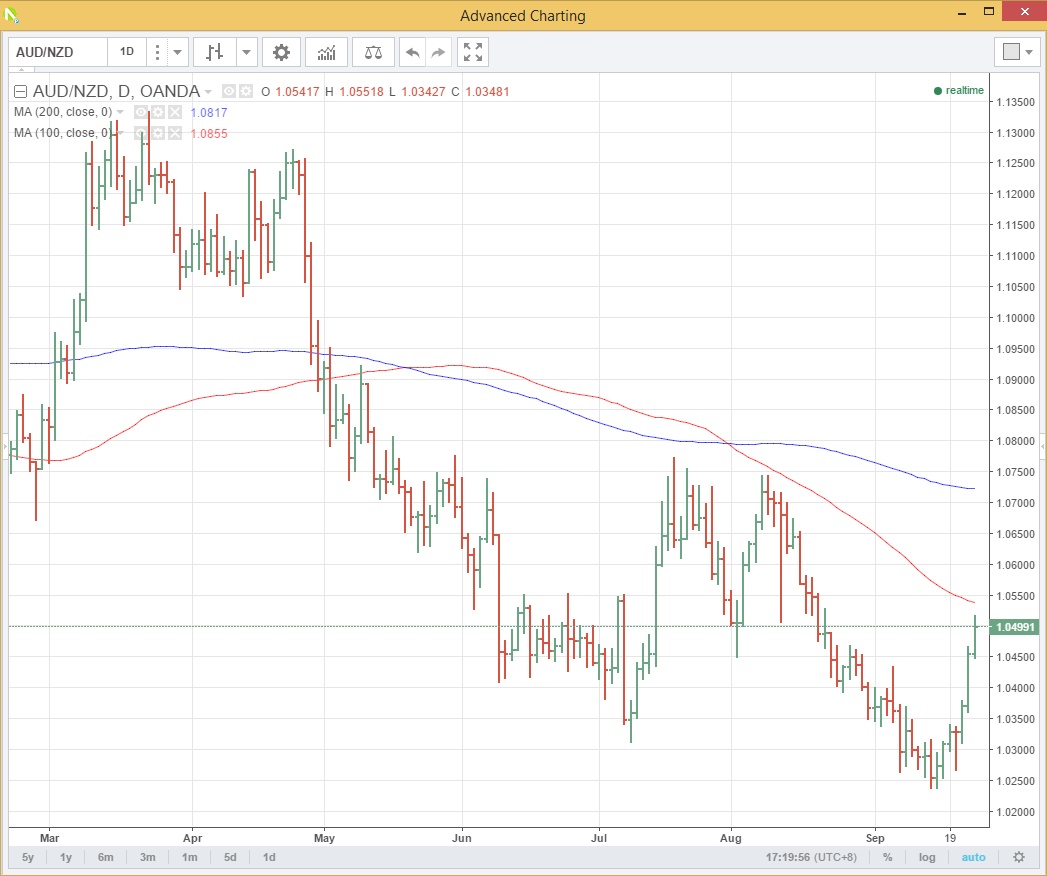
AUD/NZD
Again no arguments here. With a due not of deference to my Australian Brothers, I have always asserted that it has never made sense for a New Zealand Dollar to be worth the same as an Australian Dollar. In my career, I have yet to see a cross littered with so many trading carcases of brave souls, who have sold AUD/NZD at long-term lows looking for parity and bought at long-term highs looking for nirvana like continuations.
AUD and NZD are both almost identical G10 high yielders, neighbours, and either dig things out off, or grow things on the ground, and sell them to the rest of the world. The things Australia dig out of the ground are usually more valuable than the things New Zealand grows on it. It is as simple as that.
The chart shows AUD/NZD has lured hapless souls into shorts under 1.0500 and is brutally squeezing them out. The 100 DMA at 1.0540 is next resistance with the previous daily low at 1.0450 support. In the big picture, AUDNZD has traded around 1.0500/1.1500 for the last few years.
From a macro perspective, traders ignore this at their peril.
NZDCAD
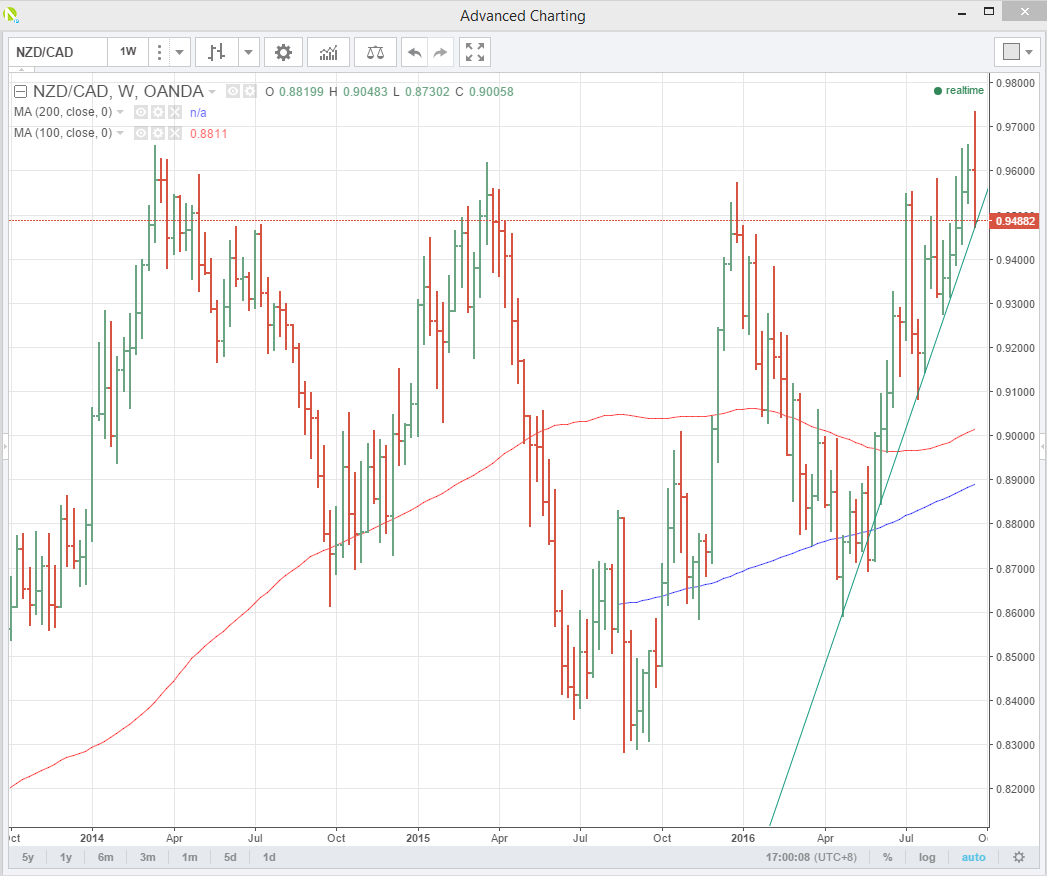
An old favourite with the inverse head and shoulders on the weekly chart. Again appearances are deceptive. The daily chart below shows the cross having broken a rough trendline going back to early June. We’ve had a couple of false breaks before, but it is the nature of this one that sets it apart.
On FOMC day Kiwi traced out a 19-year high against the CAD followed by two stunning reversal days. This pattern has continued today with NZDCAD near its lows at 9485. Resistance is at the trendline at 9500 and then 9540. Minor support at 9435.

The weekly chart shows the NZDCAD barely holding long term support. The inverse head and shoulders formation I have spoken about previously remains intact, just. The caveat here is the huge outside reversal week we have had. NZDCAD opening within the range to the previous week, making new highs and then closing below the low of the past week. Otherwise known as a bearish engulfing formation.
I acknowledge the importance of this from a technical perspective and also that a weekly close under 9450 would most likely negate the long term bullish structure. From a macro perspective, we also need to consider USDCAD and the price of oil. Crude being up 7% on the week has no doubt driven the CAD higher. This cross will most likely quite closely track the price action of oil into next week’s OPEC meeting.
Summary
The NZD has certainly had a torrid second half of the week. From a shorter-term technical view, it looks universally looks weak. However, the longer term charts reveal the picture is not so clear-cut. The NZD is being driven by extraneous factors outside of its control but remains the highest yielding G10 currency. Nevertheless, for now, the Kiwi has most certainly had its wings clipped.