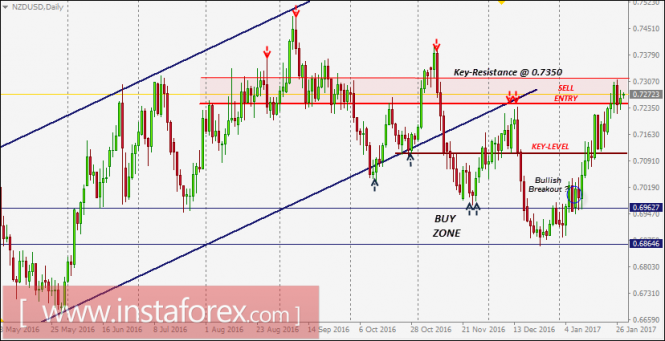
On November 8, significant signs of a bearish reversal were expressed around the upper limit of the depicted consolidation range (0.7350).
A bearish breakdown of 0.7250 (the lower limit of the depicted range) enhanced the bearish side of the market toward the price level of 0.7100 (recent bottom of October 28) which was broken as well.
Bearish persistence below 0.7100 allowed a quick decline toward 0.6960 (BUY zone) where bullish rejection and a valid BUY entry were expected. All T/P levels were successfully achieved.
Once again, bearish persistence below the price level of 0.7100 enabled the NZD/USD pair to pursue toward lower target levels around 0.6990 (the upper limit of the depicted BUY zone).
The price level of 0.6990 failed to apply enough bullish pressure. Instead of that, bearish movement continued toward the lower limit of the depicted BUY zone (0.6860) which provided significant bullish rejection on December 23.
The NZD/USD pair was trapped within the depicted price range (0.6860-0.6990) until a bullish breakout occurred.
A bullish breakout above 0.7000 allowed the pair to head toward the price level of 0.7100 (Key-Level) which failed to provide sufficient bearish pressure on the pair.
Bullish persistence above 0.7100 allowed further bullish advance toward 0.7250-0.7300 (Sell-Zone) where a valid SELL entry can be offered if enough bearish pressure is maintained (Note the bearish engulfing daily candlestick of Thursday).
The material has been provided by InstaForex Company – www.instaforex.com
The post NZD/USD Intraday technical levels and trading recommendations for January 30, 2017 appeared first on forex-analytics.press.