A key index of oil stocks continues to hold above its reclaimed 30-year old Up trendline; however, it’s been unable to mount any bounce off of it.
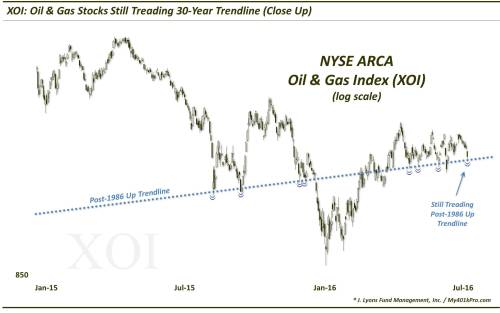
A lot of our very recent commentary has focused on the historically tight trading ranges in the major averages over the past few weeks. Whether they are digesting recent breakouts or merely reflecting the market’s “dog days of summer”, there has been precious little movement among the indices. One area that has taken that tight range to an extreme is the oil & gas sector. Since displaying a bit of a pop in mid-April, the sector has essentially gone nowhere for the past 3 months. Specifically, as measured by the NYSE ARCA Oil & Gas Index, or XOI, the sector has traded within a 9% range over the past 13 weeks (i.e., a full quarter). If that doesn’t seem that tight, consider that in the previous 3 quarters, the XOI averaged nearly a 7% range per week.
Now besides the dearth of action in the XOI, the other interesting aspect of the recent range is in its location. We have pointed out a few times (most recently in April) that the index’s lifetime Up trendline, stemming back to the lows in 1986, was still seemingly being respected by prices. Furthermore, this 30-year old trendline (which connects the lows in 2003 and late 2015) has appeared to delineate the safe periods in the sector from the “risk off” ones during 2016.
After breaking below the trendline for the first time ever at the beginning of the year, the XOI proceeded to plunge some 17%. However, since reclaiming the top of the trendline in mid-April (prompting our post), the index has held steady – albeit, in extremely boring fashion. Here is another look at the behavior of the XOI around its 30-year trendline.
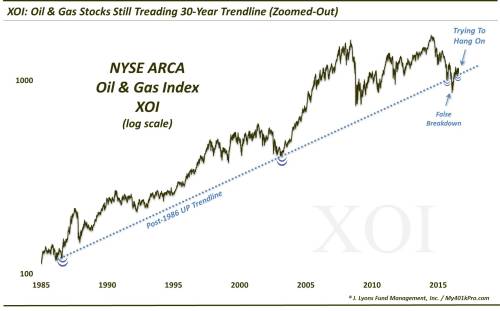
Here is a closer look since the beginning of 2015. Note how the index continues to genuinely respect the post-1986 trendline, even after 30 years and a false breakdown.
So what’s the takeaway? That’s an easy one. First, we see good news and bad news here.
The good news is that the index continues to maintain the top side of the trendline. As long as it does, any potential downside will be minimal.
The bad news is that the index has been unable to mount any semblance of a bounce off of the line since April. That is despite having plenty of opportunities to do so, including in sympathy with the large-cap breakout in early July. The longer the index continues to tread along the trendline without a bounce, the more vulnerable it is to giving way.
One more bit of potentially bad news is the fact that the largest oil stock in the world, Exxon Mobil (XOM), has just broken its own near 30-year trendline. We’ve been tracking that one for awhile as well, noting its original breakdown last June which led to a substantial selloff. XOM finally recovered the line on the last day of June before again falling below yesterday. It could be a bad omen if it leads to a similar result in the XOI.
The takeaway in all of this? We’d simply focus on the 30-year old trendline and let that guide our orientation toward the oil sector. Above it, longs may be considered, and below it, shorts – or at least avoidance. Sometimes, when you find a simple “line in the sand”, it doesn’t need to be more complicated than that.
* * *
More from Dana Lyons, JLFMI and My401kPro.

The post Oil Stocks Still Treading 30-Year “Line In The Sand” appeared first on crude-oil.top.