While the stock market saw big gains yesterday, one options exchange reported a near-record level of relative put buying.
One of the recent themes that we’ve noted – and written about – has been the considerably depressed sentiment among various investor groups. This includes survey-based sentiment as well as real-money gauges. The most noteworthy thing about this trend, in our view, is that it comes despite the persistence of most stock market averages in staying within arm’s length of their post-February rally highs. We mentioned one example from the CBOE options market a few weeks ago. Today’s example comes via the International Securities Exchange (ISE) where yesterday, in spite of the big up day in stocks, traders bought a near-record number of equity put options relative to calls.
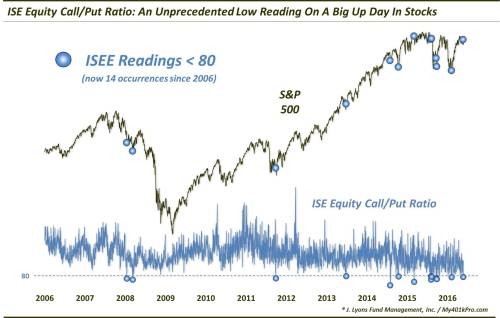
We’ve put up a number of posts regarding the ISE Equity Call/Put (ISEE) ratio in the past. As a refresher, the ISE only includes opening long volume in their calculations so, as they argue, the ratios are truer gauges of investor sentiment. Also, unlike most exchanges, the ISE expresses their options ratios with the puts as the denominator instead of the usual numerator, i.e., the ISEE Call/Put Ratio. Thus a low ratio reading indicates a high level of relative put buying whereas most exchanges report put/call ratios so that a high number would be indicative of high relative put buying. Anyway, as mentioned, yesterday’s ISEE Call/Put ratio of 76 was extremely low – the 10th lowest in the exchange’s 10-year history, in fact.
Again, what was so unusual about the reading was that it occurred while the S&P 500 gained +1.37%. That is not typically how traders operate. Rather, typically, they buy relatively large numbers of calls when the market rallies. For example, on all days since 2006 when the S&P 500 gained at least 1%, the average reading of the ISEE was 170, or nearly 100 basis points higher the reading yesterday.
Conversely, traders normally buy up relatively large numbers of puts (out of fear) when the market sells off. Indeed, this was just the 4th out of the 14 all-time readings below 80 that occurred with the S&P 500 up on the day. The average performance of the S&P 500 on the prior 13 days was -1.01%. And 2 of the prior up days were +0.12% and 0.16%. The other, on June 27, 2013, saw the S&P 500 up 0.62%. So, yesterday’s +1.37% was by far the most positive market day of any seeing such extreme low ISEE readings.
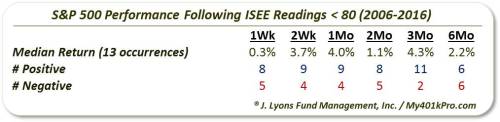
So what is the value in this data point? Well, in a vacuum, S&P 500 returns have been quite good following readings below 80. Here are the aggregate numbers following all 13 prior instances since 2006 – not too bad, particularly over the short to intermediate-term of 2 weeks to 3 months.
From a glance at the chart, you may notice that these occurrences of the ISEE registering less than 80 normally – and not surprisingly – occur following a selloff of some degree. You may also notice a few (4) outliers on the chart, e.g., from March and August of last year, that occurred in the absence of much or any decline.
Specifically, the 9 prior instances outside of those outliers had seen a median 1-month decline in the S&P 500 of -4.0% and occurred a median of -10.3% below the 52-week high. The 4 outliers took place into a median 1-month gain of +0.81% and a mere median of -2.21% from a 52-week high.
We mention this because, outside of those outliers, the S&P 500 returns have been even better following ISEE readings below 80. In fact, all of the losses in the table above on a 2-week, 1-month and 3-month time-frame occurred following those outlier dates. Here is the performance excluding those March and August 2015 readings.
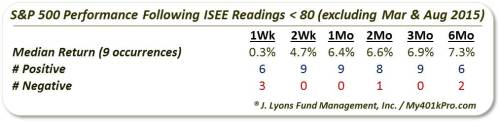
Now, we’d like to say just dismiss those outliers from 2015 and go with this 2nd table. However, 1) we don’t like to dismiss any data subjectively, 2) these outlier data points were fairly recent so they are not as easily thrown out as perhaps they would have been had they occurred 10 years ago, and 3) our present circumstances are not too dissimilar to these outliers. How so? The S&P 500′s present 1-month loss of -0.75% and -2.45% from the 52-week high are among the mildest conditions of all the events.
What’s the takeaway? While some of the conditions surrounding this atypical ISEE reading may themselves be atypical, our best guess is that this data point reinforces what we have been seeing and reporting on the sentiment front. Specifically, despite a stock market that continues to remain resilient, traders are displaying an inordinate, and unusual, level of caution – in both their words and their actions. All else being equal, this *should* be a positive for stock prices.
* * *
More from Dana Lyons, JLFMI and My401kPro.

The post Options Traders Continue Their Unusual Hedging appeared first on crude-oil.top.