Overview:
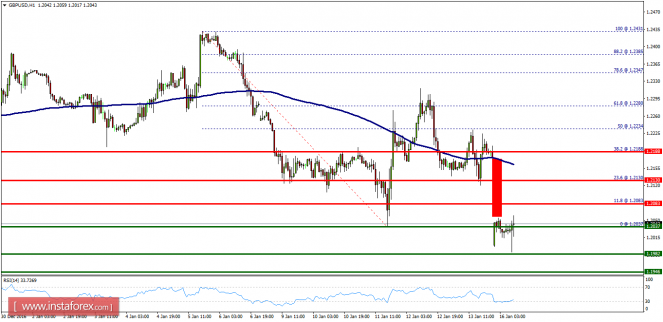
- The market has opened below the first resistance of 1.2083 (look the gap). Today, probably, it continues to move downwards from the level of 1.2083 to the bottom around 1.1982. The first resistance level is seen at 1.2083 followed by 1.2130, while daily support levels are seen at 1.1982 and 1.1946. Furthermore, the moving average (100) starts signaling a downward trend; therefore, the market is indicating a bearish opportunity below 1.2080. So it will be good to sell at 1.2080 with the first target of 1.1982. It will also call for a downtrend in order to continue towards 1.1946.
The strong daily support is seen at the 1.1946 level. According to the previous events, we expect the GBP/USD pair to trade between 1.2080 and 1.1950 in coming hours. The price area of 1.2080 remains a significant resistance zone. Thus, the trend is still bearish as long as the level of 1.2080 is not broken. On the contrary, in case a reversal takes place and the GBP/USD pair breaks through the resistance level of 1.2080, then a stop loss should be placed at 1.2150
The material has been provided by InstaForex Company – www.instaforex.com
The post Technical analysis of GBP/USD for January 16, 2017 appeared first on forex-analytics.press.