Gold price so far has made a shallow correction as low as $1,194 where prices reached the 4-hour Ichimoku cloud support and bounced back above $1,200. Gold price could see $1,210-15 today but bulls need to be very cautious as a break below $1,194 will open the way for a push towards $1,180-70.
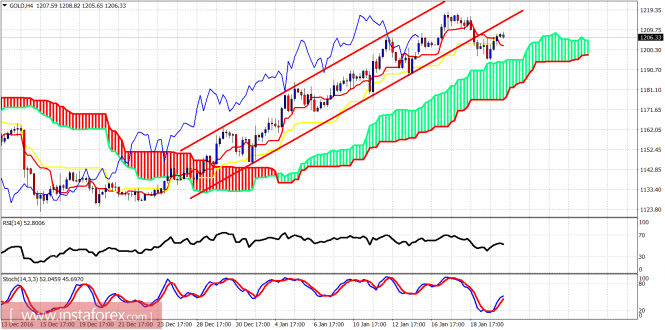
Red lines – bullish channel
Gold price has broken out and below the bullish channel implying that Gold is in a corrective phase. This correction could push Gold price even towards $1,160 and still hold our bullish long-term scenario valid. Cloud support is at $1,194. If broken Gold price should move towards $1,180. Resistance is at $1,220.
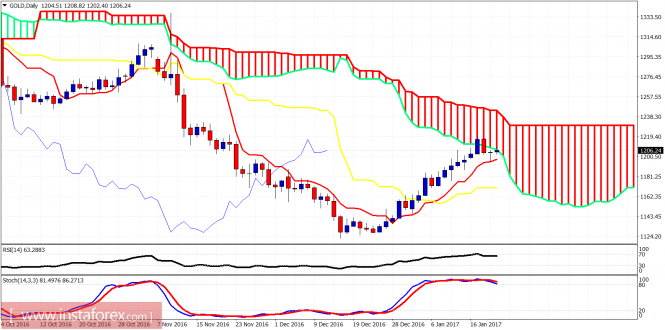
Gold price is testing daily cloud resistance. Price is trying to break inside the daily cloud. Price pulled back yesterday but the daily tenkan-sen (red line indicator) supported price. The oscillators are near overbought area but there is no divergence on the daily chart. Daily kijun-sen (yellow line indicator) is found at our important support of $1,160. Pull backs are to be bought. I do not expect Gold to make new lows below $1,122.The material has been provided by InstaForex Company – www.instaforex.com
The post Technical analysis of gold for January 20, 2017 appeared first on forex-analytics.press.