Overview:
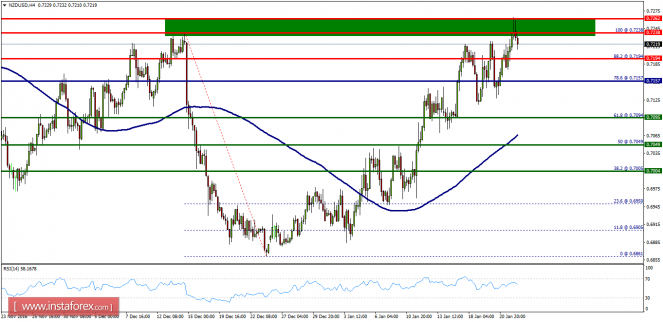
- The NZD/USD pair has faced strong resistances at the levels of 0.7262. So, the strong resistance has been already formed at the level of 0.7262 and the pair is likely to try to approach it in order to test it again. However, if the pair fails to pass through the level of 0.7262, the market will indicate a bearish opportunity below the new strong resistance level of 0.7262. Moreover, the RSI starts signaling a downward trend, as the trend is still showing strength above the moving average (100). Thus, the market is indicating a bearish opportunity below 0.7262 – 0.7238 so it will be good to sell at 0.7262 with the first target of 0.7197. It will also call for a downtrend in order to continue towards 0.7157 in order to test the weekly pivot. The daily strong support is seen at 0.7157. However, the stop loss should always be taken into account, for that it will be reasonable to set your stop loss at the level of 0.7310.
The material has been provided by InstaForex Company – www.instaforex.com
The post Technical analysis of NZD/USD for January 24, 2017 appeared first on forex-analytics.press.