Overview:
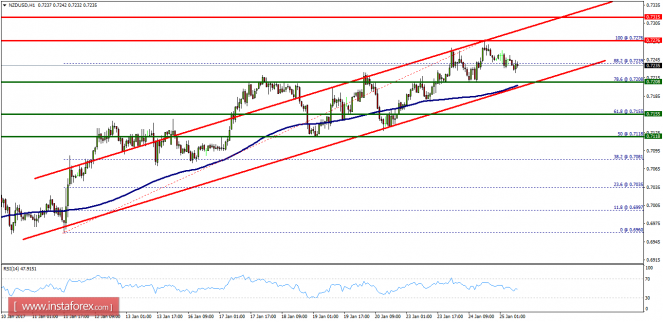
- The NZD/USD pair is likely to continue straight from the level of 0.7208. Support at 0.7208 coincides with ratio of 78.6% Fibonacci retracement level on the H1 chart. Additionally, it is probably tend to form a double bottom at the same level. Therefore, the kiwi shows signs of strength following the break through the highest levels of 0.7208. So, it is going to be a good sign to buy above the support levels of 0.7208 with the first target at 0.7276 in order to retest the double top. If the trend can break the point of 0.7276, it will continue towards the next target of 0.7315. However, in case a reversal takes place and the NZD/USD pair breaks through the support level at 0.7208, the pair will be led to a further decline to 0.7155 and 0.7118 in order to indicate the bearish market.
But in overall, we still confirm the bullish scenario as the trend is still above the major support of 0.7208.
The material has been provided by InstaForex Company – www.instaforex.com
The post Technical analysis of NZD/USD for January 25, 2017 appeared first on forex-analytics.press.