The Dollar index bounced strongly yesterday after the comments made by ECB President Mario Draghi. However price never managed to break above the important cloud resistance we mentioned and this bounce was a perfect opportunity to sell the index again.
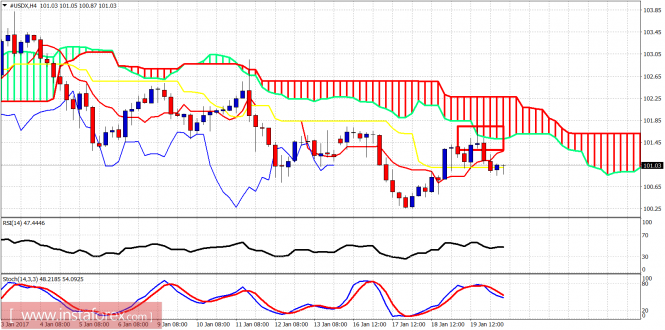
The Dollar index formed an upper long shadow candlestick on the 4-hour chart when price reached the Ichimoku cloud resistance. Price got rejected and this reversal signal confirmed that the upward move was just a corrective wave inside a bigger downward move that started above 103.50. Price continues to make lower highs below the Ichimoku cloud and there is no divergence on the 4-hour chart that justifies trend change.
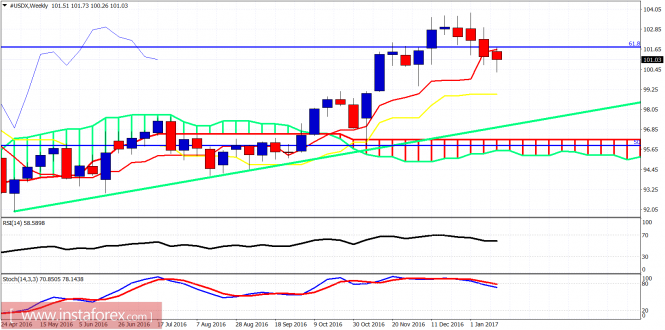
Green line – long-term support
The weekly candle back tested the tenkan-sen (red line indicator) and got rejected. I continue to expect the Dollar index to move lower towards the kijun-sen (yellow line indicator) at 99. The weekly oscillators however point to much lower targets and even below the long-term support green trend line.
The material has been provided by InstaForex Company – www.instaforex.com
The post Technical analysis of USDX for January 20, 2017 appeared first on forex-analytics.press.