The Dollar index has started providing bullish divergence signs in the 4-hour RSI. This is the first non-confirmed low in the Dollar index. Yesterday I supported the view that the new low was expected to be weak and soon we should see a strong upward bounce.
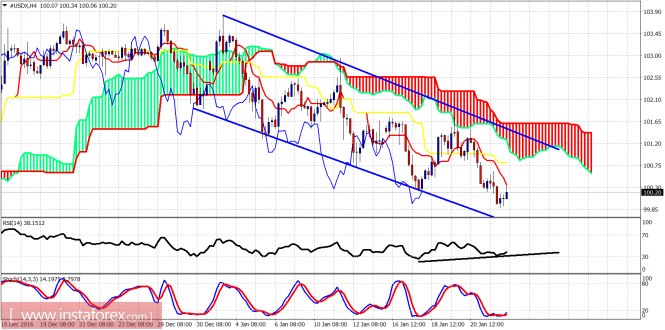
Blue lines – bearish channel
The early bounce towards 100.60 was weak and price reversed and provided a new lower low at 99.87 which was closer to our target. The new low was not confirmed by the RSI. The Dollar index remains inside the bearish channel and below the Ichimoku cloud. Trend remains bearish. Resistance is at 101. We could see a test of that area today.
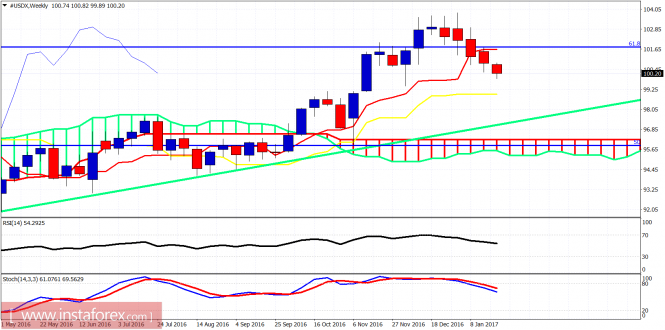
The weekly chart continues to favor a move towards the kijun-sen (yellow line indicator) at 99. As long as price is below the tenkan-sen (red line indicator) at 101.60 we remain in bearish trend. The weekly chart has much more room to the downside but short-term time frames need to work off the oversold levels.The material has been provided by InstaForex Company – www.instaforex.com
The post Technical analysis of USDX for January 24, 2017 appeared first on forex-analytics.press.