![]()
![]()
![]()
Rally runs out of steam
It’s been quite a 24 hours in stock markets, with risk appetite suffering due to a combination of factors including earnings and global recession warnings. This was always going to test this new-found bullishness in the markets.
As always, these may have been the catalyst for the sell-off but there will be other underlying factors as well. For example, just prior to stocks turning red, the Dow has made up 50% of those remarkable losses incurred in late February/early March and peaked around 24,000. It’s not altogether surprising that this was viewed as a good time to take some cash off the table, especially going into an incredibly unpredictable earnings season.
UK100 (FTSE 100) Daily Chart
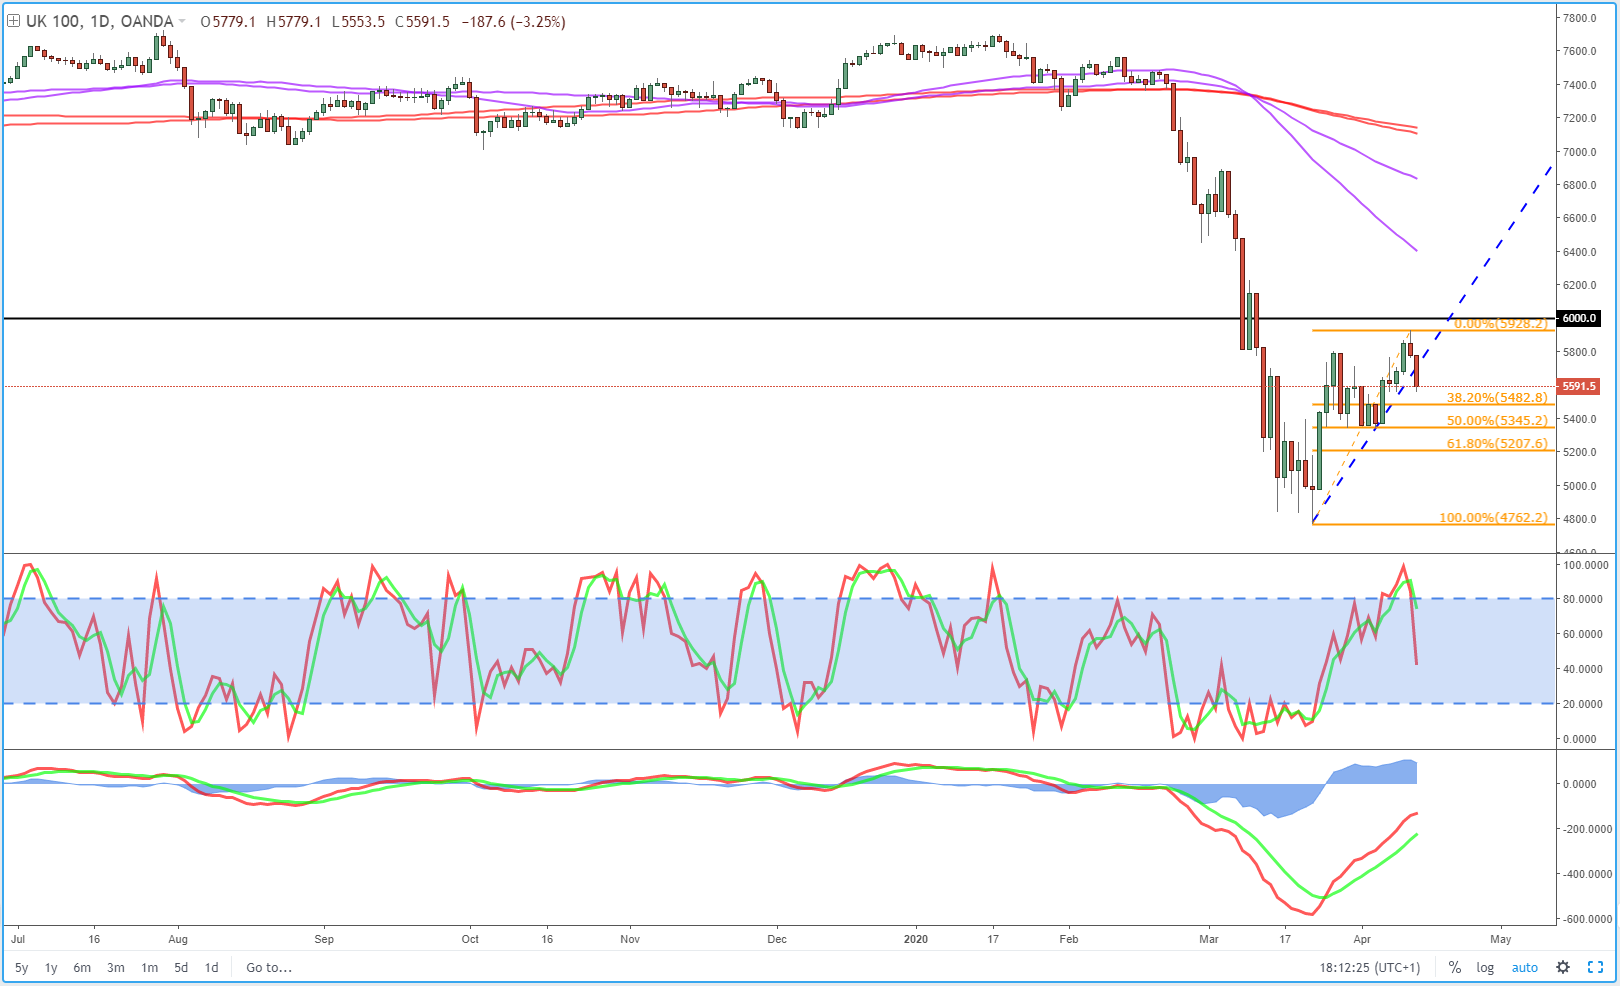
OANDA fxTrade Advanced Charting Platform
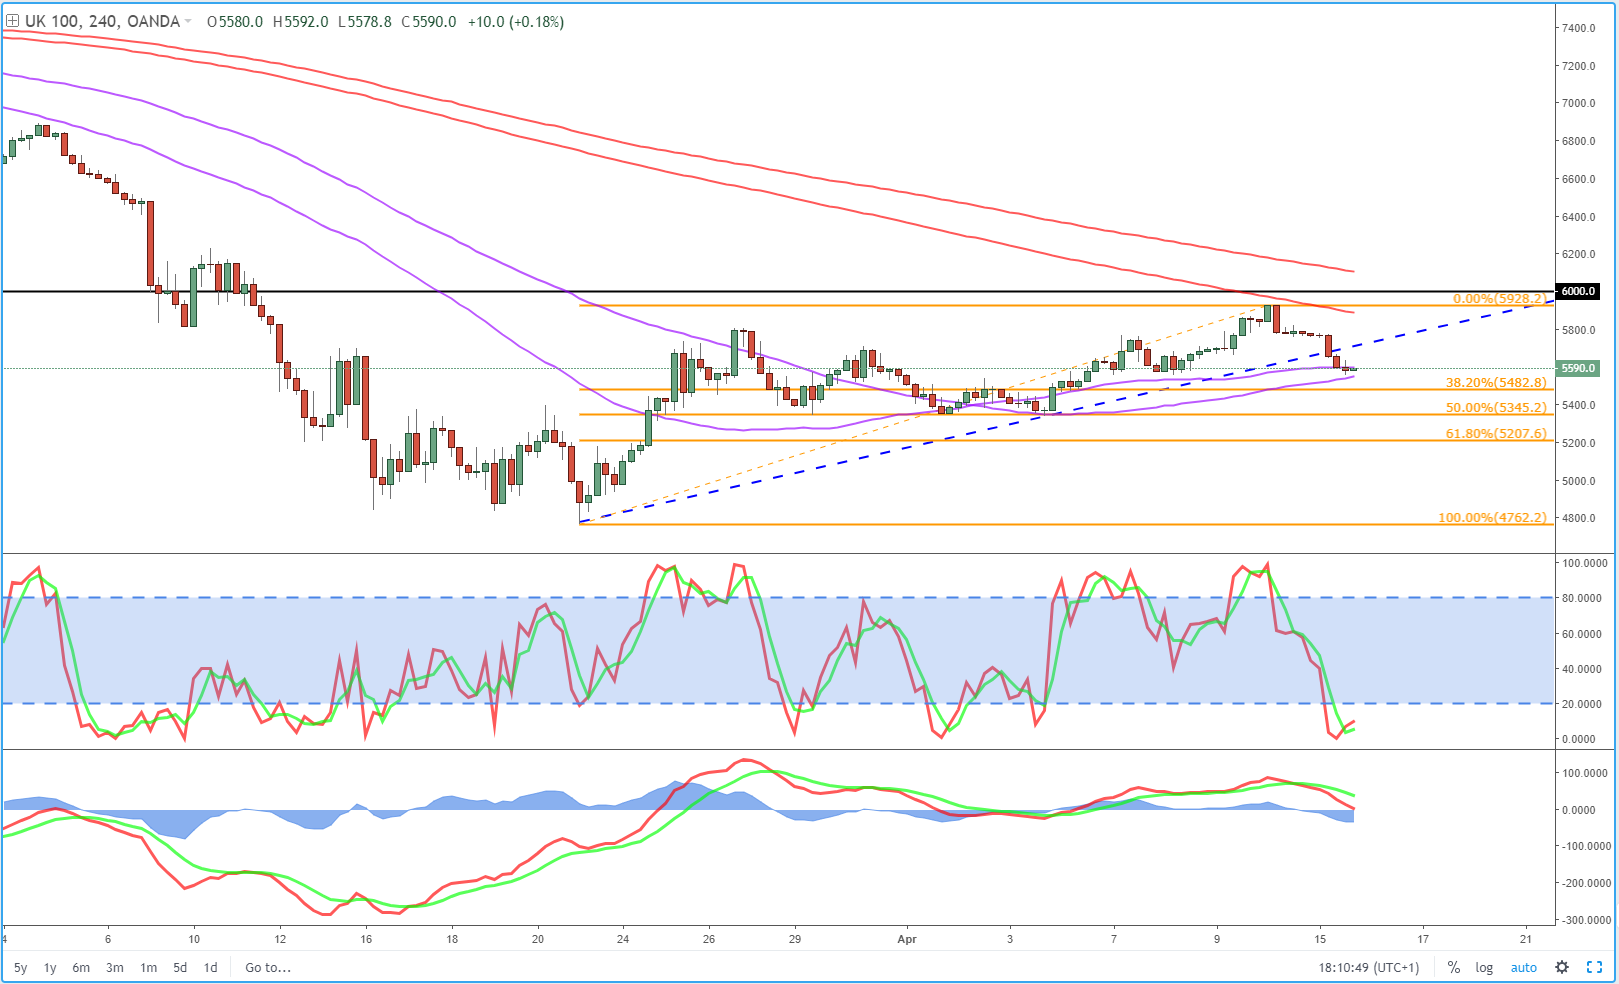
Whatever the reason, the break of the trend line suggests the near-term trend has shifted and stocks may come under a little pressure. The 55 and 89 SMA band on the 4-hour chart could be an interesting first test, coinciding with prior support and resistance , potentially even triggering a little retracement to the upside. But if that’s all it is – and I suspect it may be – the real test lies around 5,350.
This is the 50% retracement level of the move from the lows to this week’s peak and could tell us whether this is a bear market rally or a bottomed market with strong upside potential. A break of 50% doesn’t confirm the former, it should be stressed, but it would certainly strengthen the case. Below here 5,200 will be interesting (61.8%).
UK100 (FTSE 100) 4-Hour Chart