![]()
![]()
![]()
6,000 looking vulnerable
Recent price action in the FTSE 100 (UK 100) has certainly been encouraging but it may be a little early to celebrate.
UK100 Daily Chart
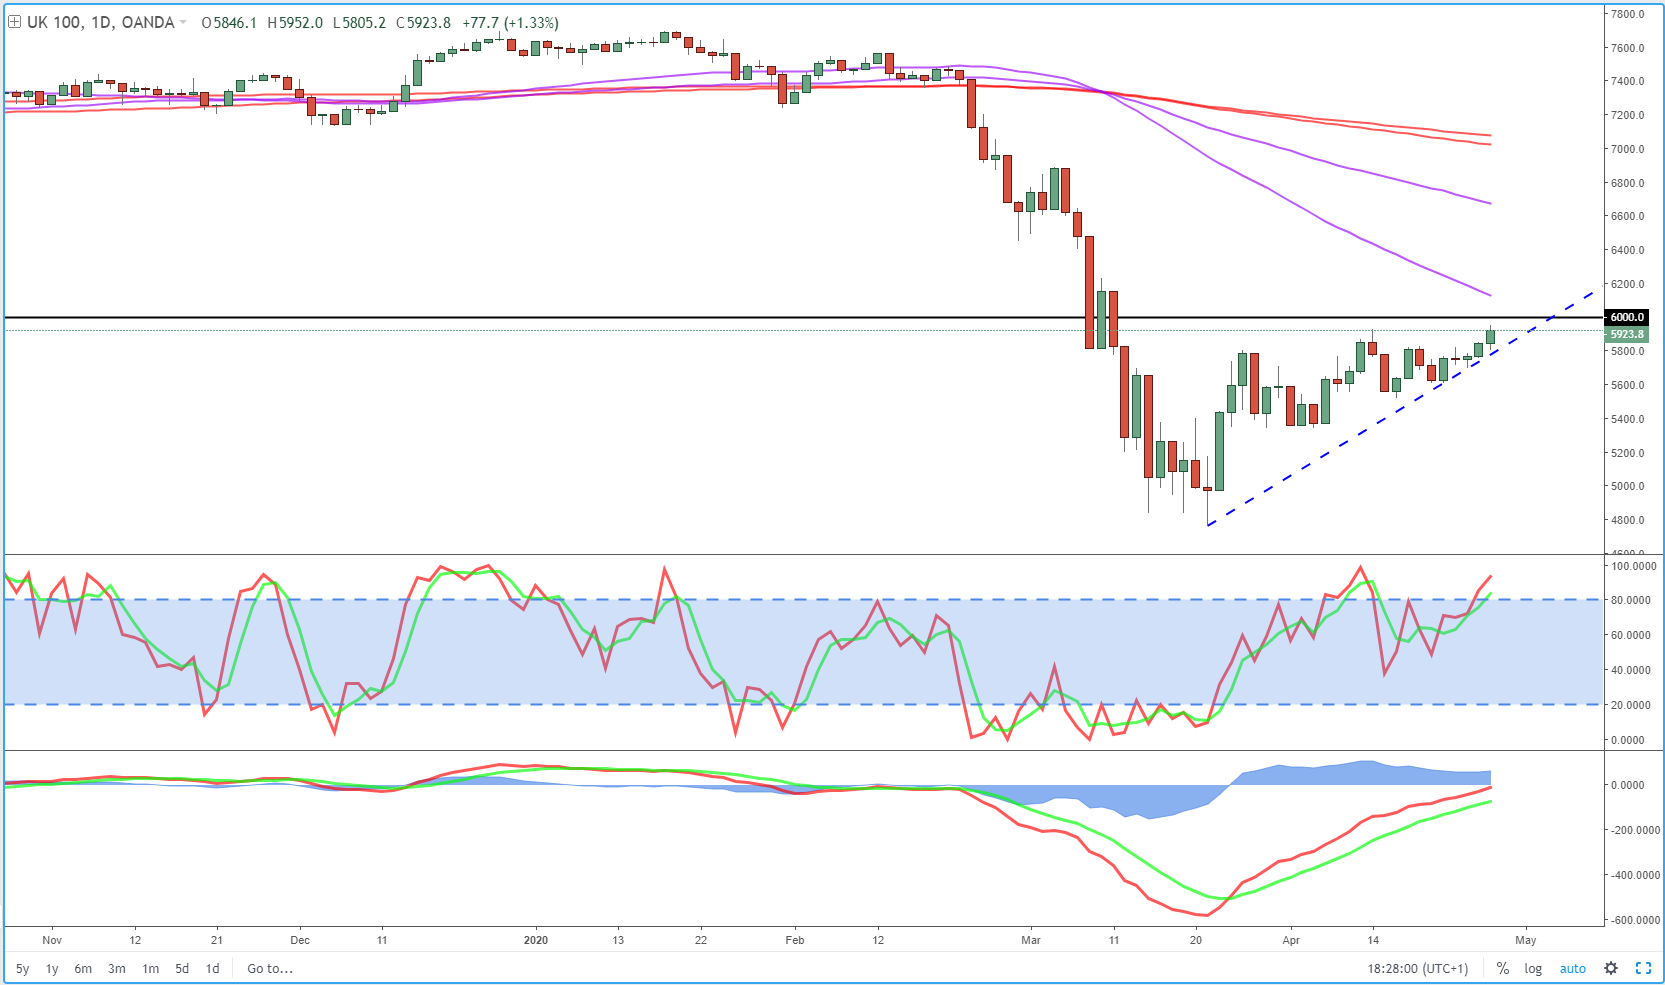
OANDA fxTrade Advanced Charting Platform
The pull back a couple of weeks ago was very brief and never really gathered any momentum. Moreover, broadly speaking price never held below the 55/89 simple moving average band on the 4-hour chart, which could be viewed as bullish.
Since then we’ve seen a series of higher lows and the index has broken and held above the 200/233 SMA band, another bullish signal, as it’s traded below here since 20 January – surviving a few tests along the way – and we all know what followed then.
UK100 4-Hour Chart
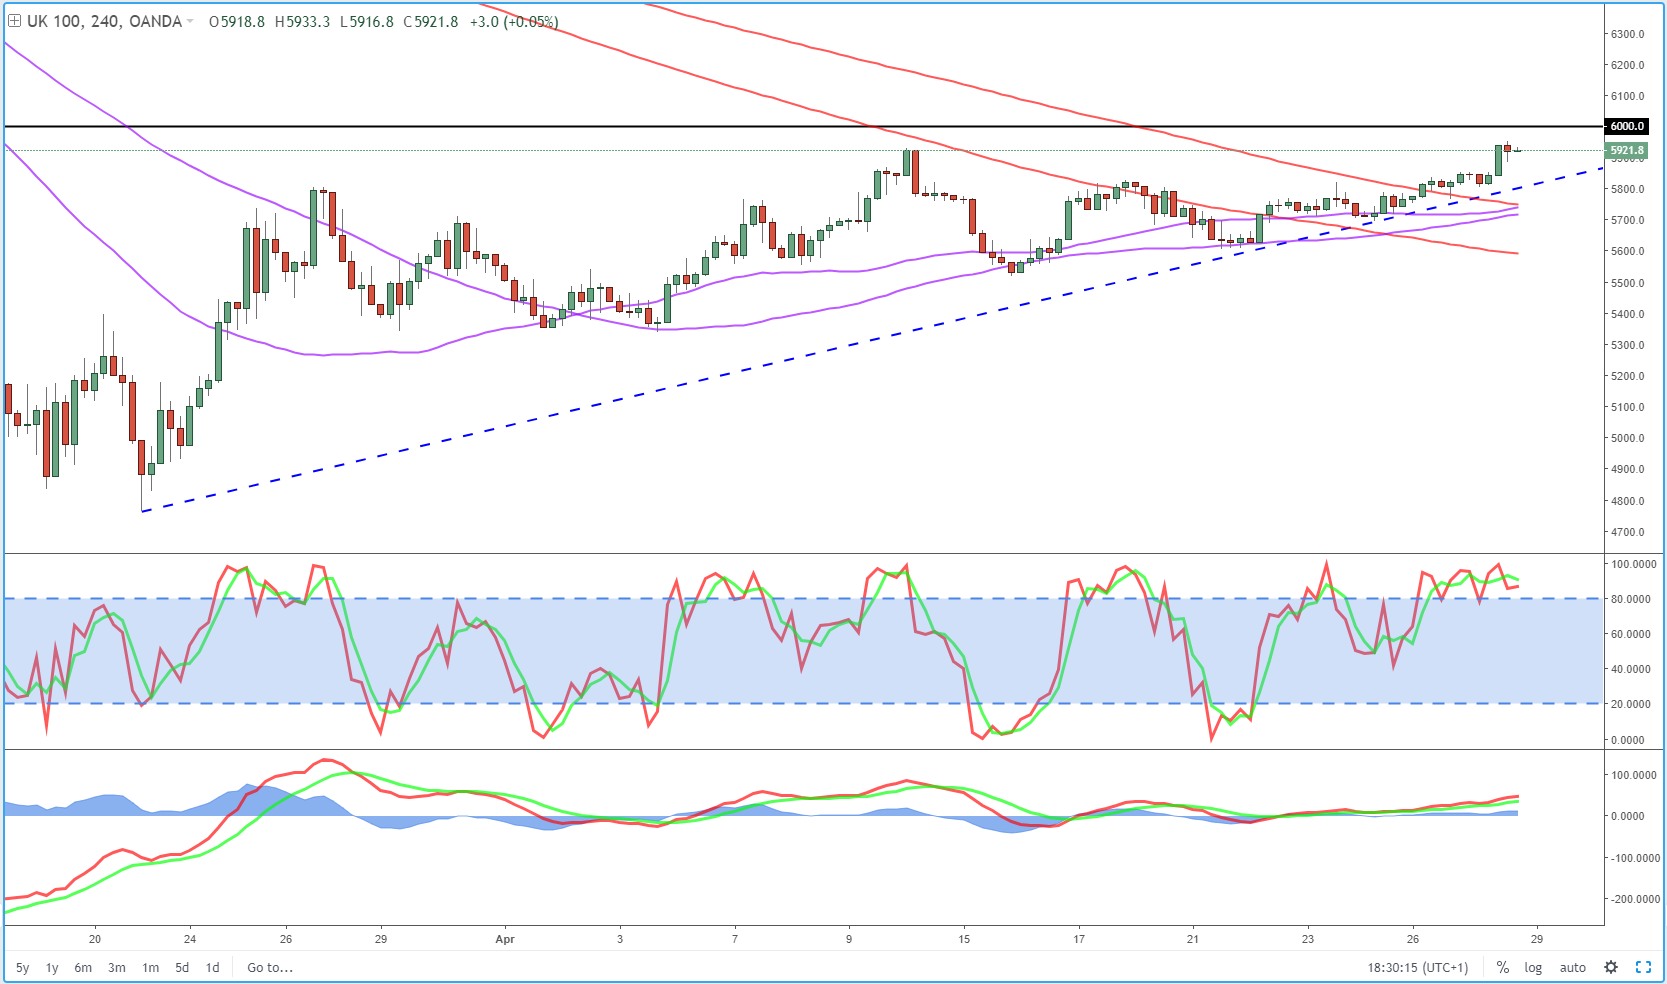
OANDA fxTrade Advanced Charting Platform
If the index can break 6,000 then any hope of a test of 5,450 – 50% retracement of lows to April highs – may well be lost and the bullish buzz may once again kick in.
This is a huge earnings week for the US, the next 48 hours or so of which will be pivotal. If stock markets can get through that unscathed, even encouraged, it could be the catalyst for another strong rally, with 6,200 being the next test but 6,500 the next key level.