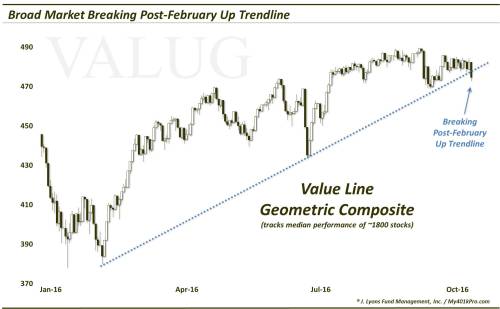
This broad gauge of the equity market (among others) has snapped its post-February uptrend line.
The 2 signature events in the U.S. stock market thus far in 2016 are: 1) the post-February rally, and 2) the January-February plunge (in order of importance). A distant 3rd would be the Brexit affair. This post relates to #1. A few weeks ago, we noted that several major equity indices were testing the Up trendline defining their post-February rallies (i.e., the line connecting the February low and Brexit low). These averages were able to hold their respective trendlines and preserve their uptrends. Until yesterday. Yesterday was perhaps a key day on an intermediate-term basis in that many indices saw their post-February Up trendlines broken. Included among them was the Value Line Geometric Composite (VLG).
The VLG, as we’ve mentioned often, is perhaps our favorite measure of the performance of the broad U.S. equity market. It is an equal-weight index of approximately 1800 stocks, calculated via the median stock in that universe. Thus, it truly is a measure of the broad market rather than a skewed, cap-weighted index. And despite not being tied to any investable vehicle, that we are aware of, the VLG conforms very well to charting analysis. That’s why we view the VLG’s post-February trendline break as significant, in a negative way.
In the post a few weeks ago, we focused on another broad market gauge, the NYSE Composite, which, by the way, also snapped its post-February trendline yesterday. Regarding the NYSE’s trendline test, we stated the following, which is also applicable to the VLG index and others:
“Is it the end of the world if this line gets broken? Not really, but it may be the end of the post-February intermediate-term rally in stocks. Or, at a minimum, it may signal the end of the post-Brexit phase of the rally. Considering the way the NYSE has closely adhered to the trendline, prices certainly seem to “respect” the line. Thus, in the short-term, upon a hypothetical break of the trendline, a quick acceleration to the downside would seem to be a reasonable risk.
Again, a break of this trendline doesn’t necessarily mean the larger trend has turned down. It may just mean a shallower trajectory once the rally resumes. But it certainly opens the market up to not insignificant short-term risk. And on an intermediate-term basis, it would be one of the first chinks in the armor of the impressive post-February rally.”
That short-term “not insignificant” risk would seem to now be on the table here. And on an intermediate-term scale, following 8 months of a pretty persistent rally, some corrective medicine is certainly in the realm of possibility, or even expectation, both in terms of price and time. (FYI, this elevated risk assessmnet surrounding this trendline break is further enhanced by the proprietary risk analysis that we conduct on a continual basis in our investment services).
* * *
More from Dana Lyons, JLFMI and My401kPro.

The post US Equity Markets Break Key Technical Support appeared first on crude-oil.top.