Submitted by Lance Roberts via RealInvestmentAdvice.com,
Due to the holiday, I did not write my normal weekend missive, so I have a few things to catch up on from last weeks “Technically Speaking” which discussed the entrance into a market melt-up. To wit:
“As I have noted, there are many similarities in market action between the “post-Trexit” bounce, “Brexit” and last December’s Fed rate hike. I have highlighted there specific areas of note in the chart.”
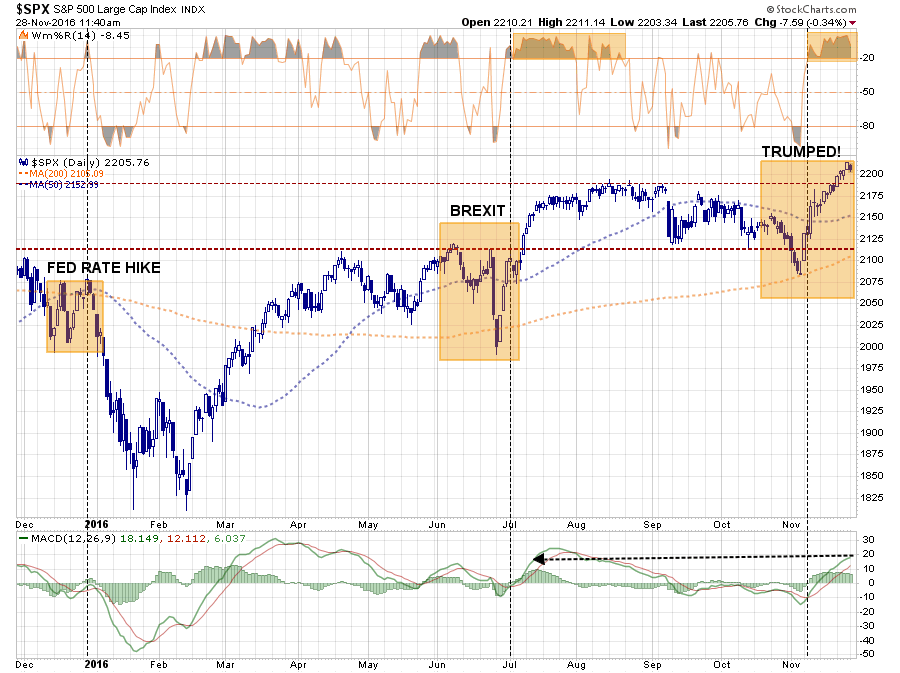
“As with ‘Brexit’ this past June, the markets sold off heading into the vote assuming a vote to leave the Eurozone would be a catastrophe. However, as the vote became clear that Britain was voting to leave, global Central Banks leaped into action to push liquidity into the markets to remove the risk of a market meltdown. The same setup was seen as markets plunged on election night and once again liquidity was pushed into the markets to support asset prices forcing a short squeeze higher.”
And, as I noted then:
“So, with that breakout, I am increasing equity risk exposure to portfolios. “
However, as I also noted, I tempered that increase in equity increase with interest-rate sensitive exposure. This exposure will act as a hedge against a sudden reversal in rates, and the dollar, as economic realities eventually collide with the “Trump rally” fantasy.
Despite the rally from the election lows, which has been ebullient, to say the least, we need to remain cognizant of the underlying risks currently developing in the market. That is the focus of today’s analysis which takes a look at the different between what we “see” versus what “really is.”
Market Strength Not What It Seems
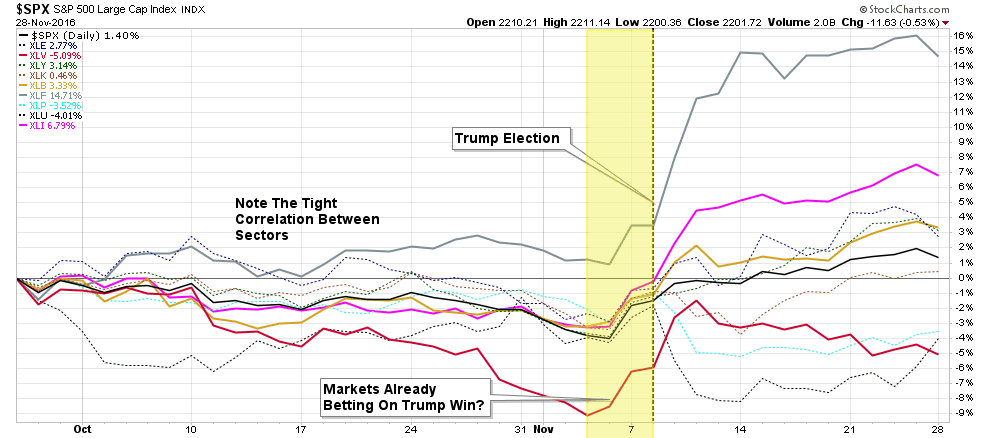
First, despite all of the media chatter of the markets hitting “all-time highs,” such lofty attainment has not been uniform across markets and sectors. As shown in the charts below, relative performance has been bifurcated between domestic and international exposure. As such, any portfolio which has been “diversified” in recent weeks has lost ground to the broad market domestic indices.

So, despite all of the rhetoric about the benefits of “indexing,” such has not worked given the recent state of the markets.
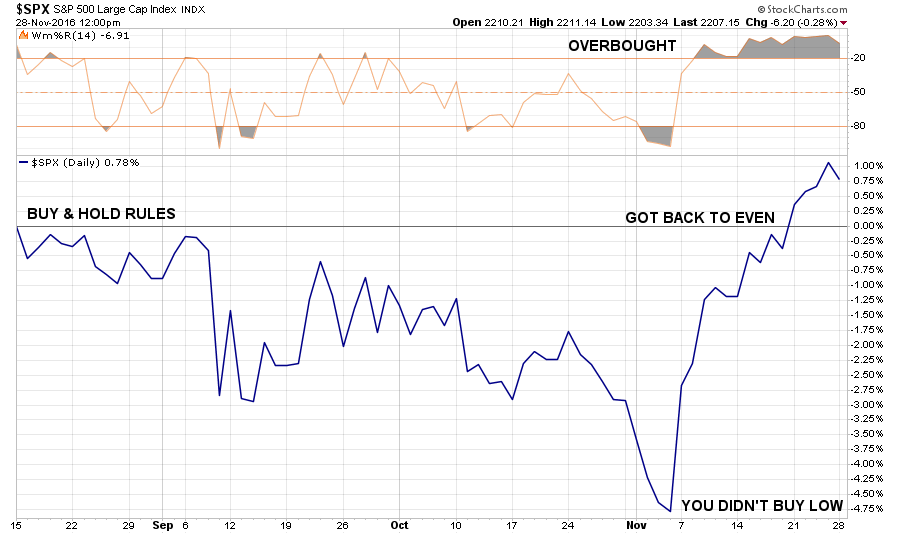
More importantly, since individuals are consistently told to only “buy and hold” within their portfolios, there has been little gained in recent months as the index is only slightly higher (0.75%) than it was prior to the election
However, in the short-term, there are bullish arguments to certainly be made for the market.
- We are entering into the “seasonally strong” period of the year which typically generates the bulk of returns for stocks.
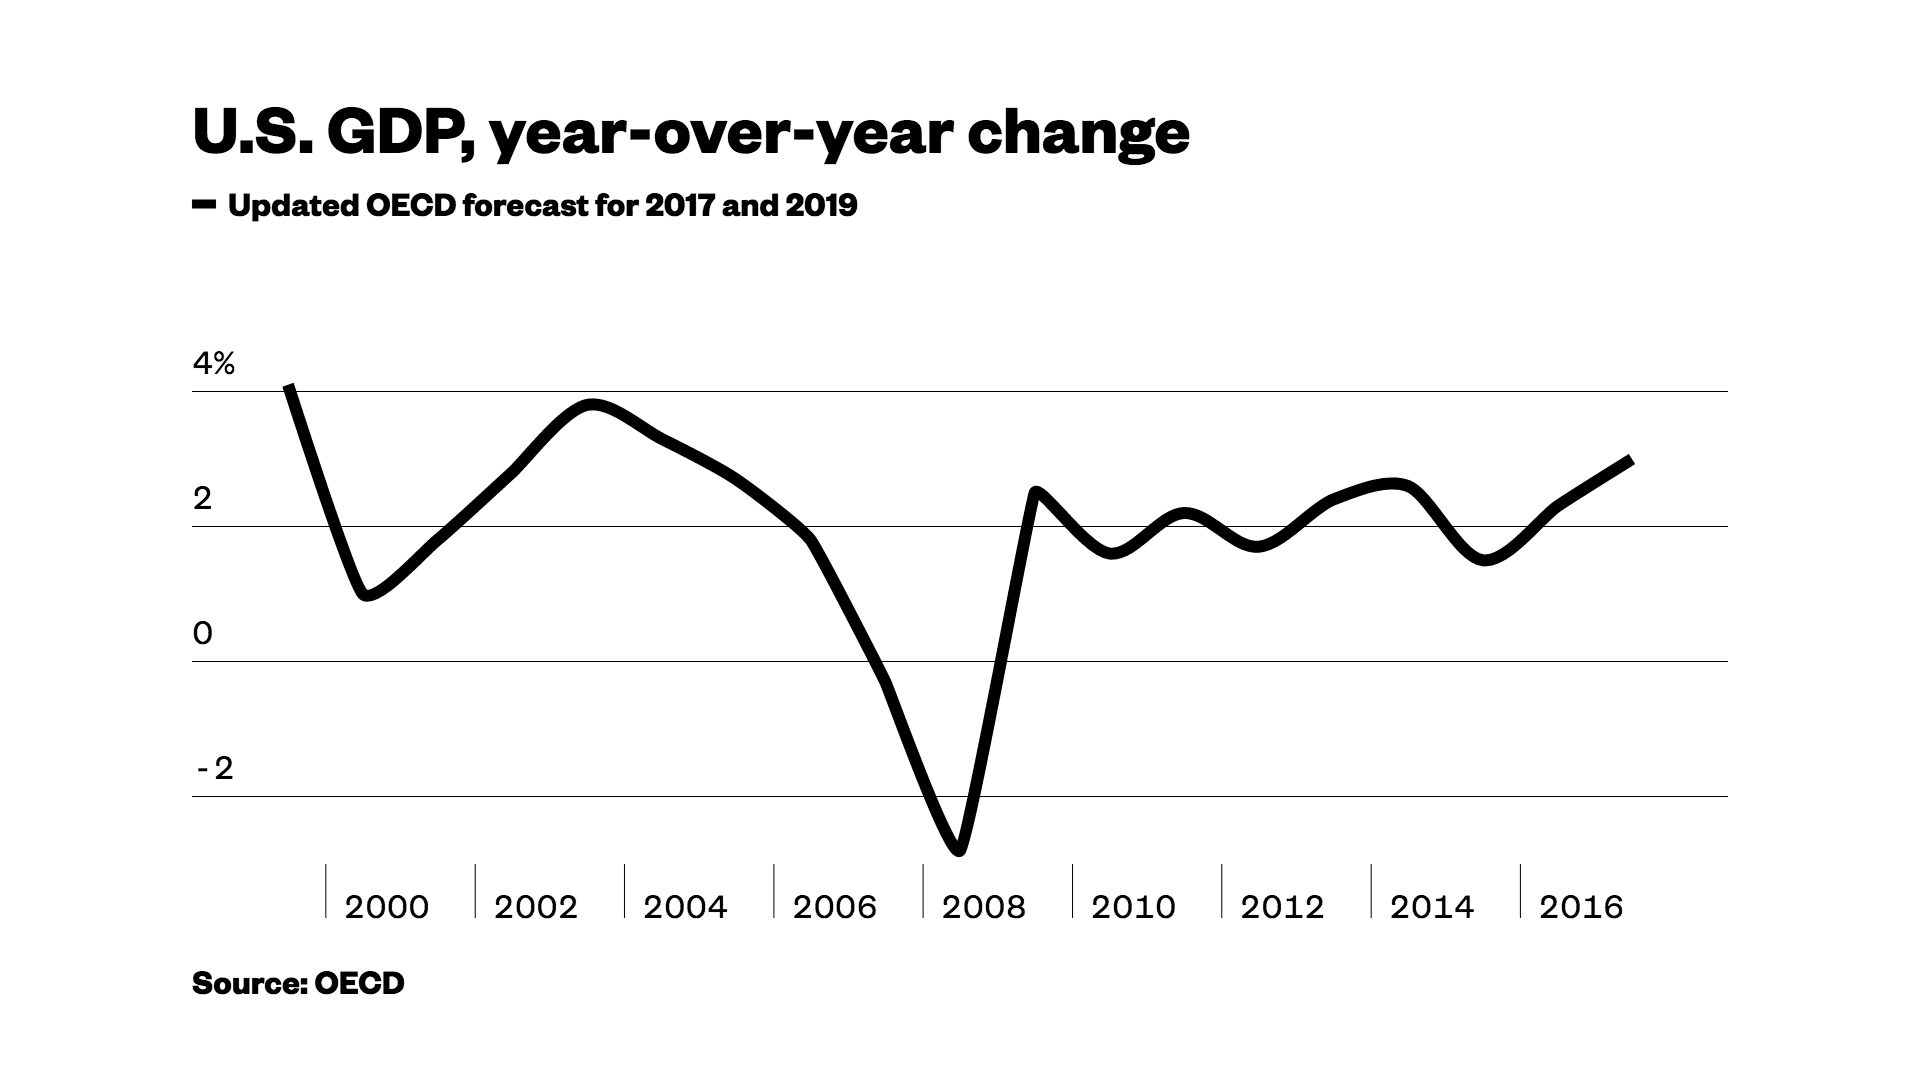
- The “hope” for a massive infrastructure spending package, combined with tax cuts, from the “Trump” administration has not only bolstered hopes for a stronger domestic economy, but a global recovery as well. Such was noted by the OECD recently:
“GDP is projected to return to a moderate growth trajectory in 2017 and strengthen in 2018, mainly due to the projected fiscal stimulus, which takes effect particularly in 2018. Indeed, projected fiscal support will boost GDP growth by just under ½ and 1 percentage point in 2017 and 2018 respectively.”
Such an outlook is certainly encouraging, but there is a long way to go between President-elect taking office, drafting bills and getting them passed. There is even a further period of time before any actions actually passed by the Trump administration actually create perceivable effects within the broader economy. In the meantime, there are many concerns, from a technical perspective, that must be recognized within the current market environment.
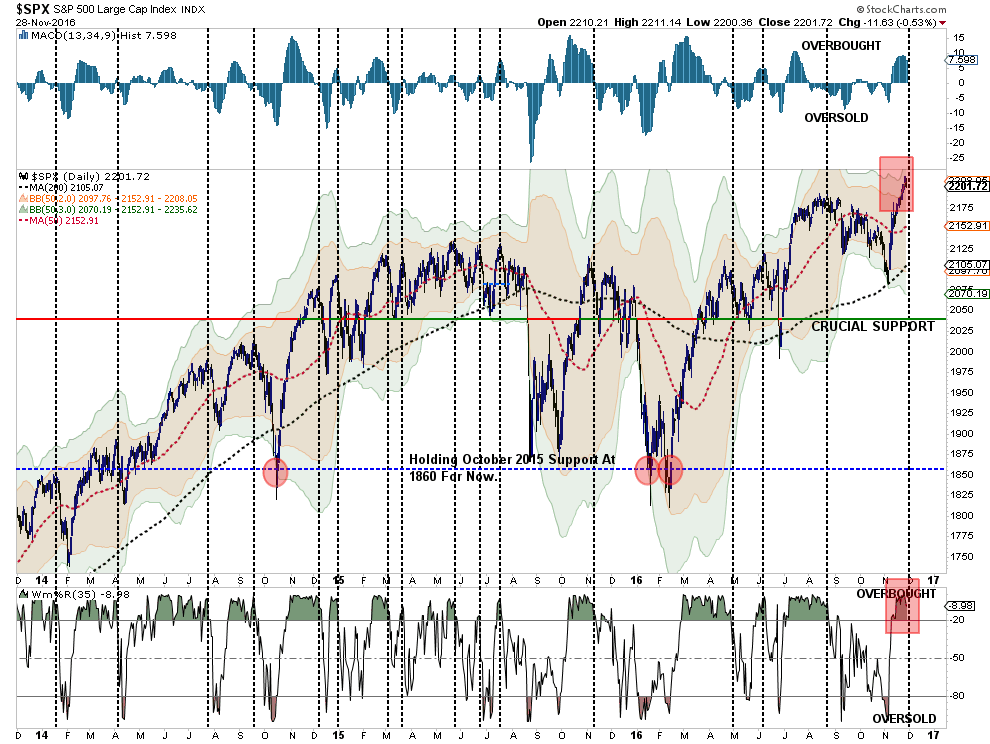
First, the market has moved from extremely oversold conditions to extremely overbought in a very short period. This is the first time, within the last three years, the markets have pushed a 3-standard deviation move from the 50-day moving average. Such a move is not sustainable and a correction to resolve this extreme deviation will occur before a further advance can be mounted. Currently, a pullback to the 50-day moving average, if not the 200-dma, would be most likely.
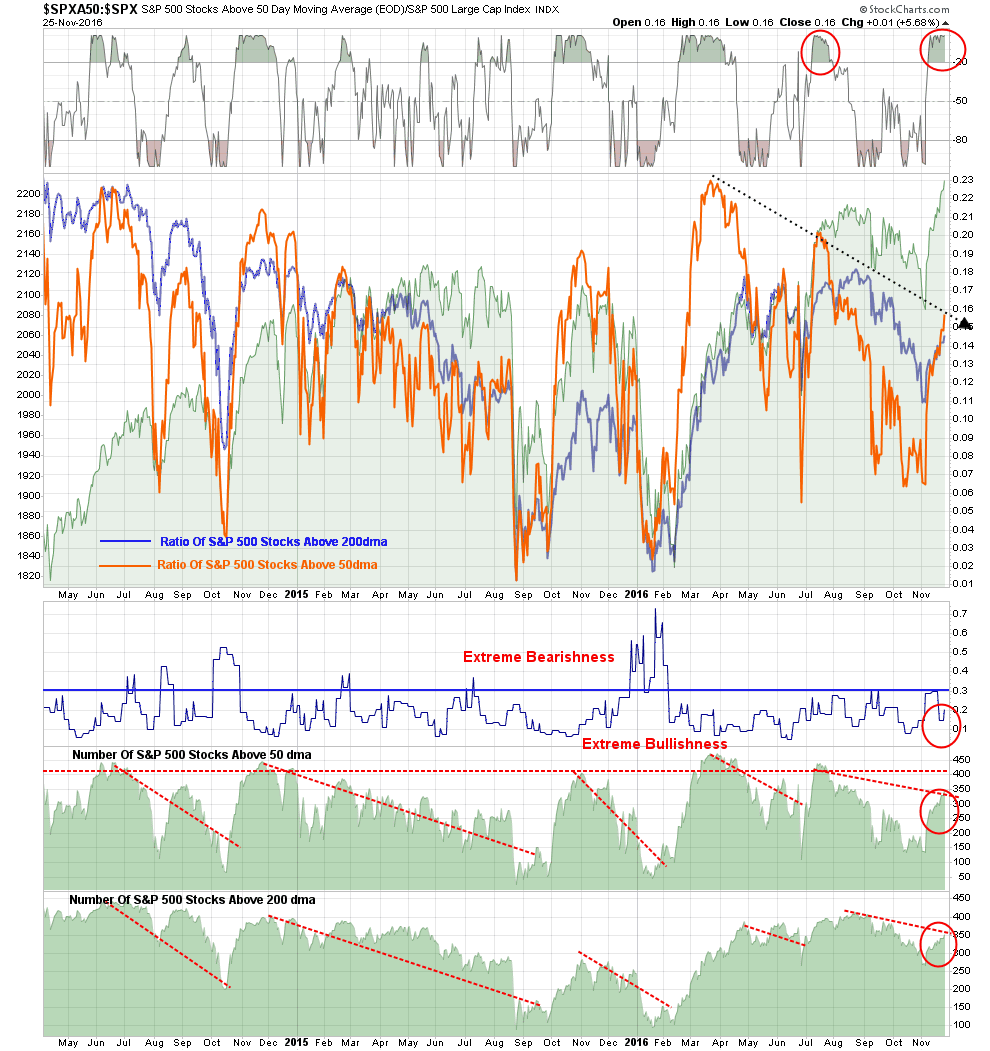
Secondly, as discussed above, the advance to “all-time highs” has been narrowly defined to only a few sectors. As shown the number of stocks participating, while improved from the pre-election lows, remains relatively weak and does not suggest a healthy advance.
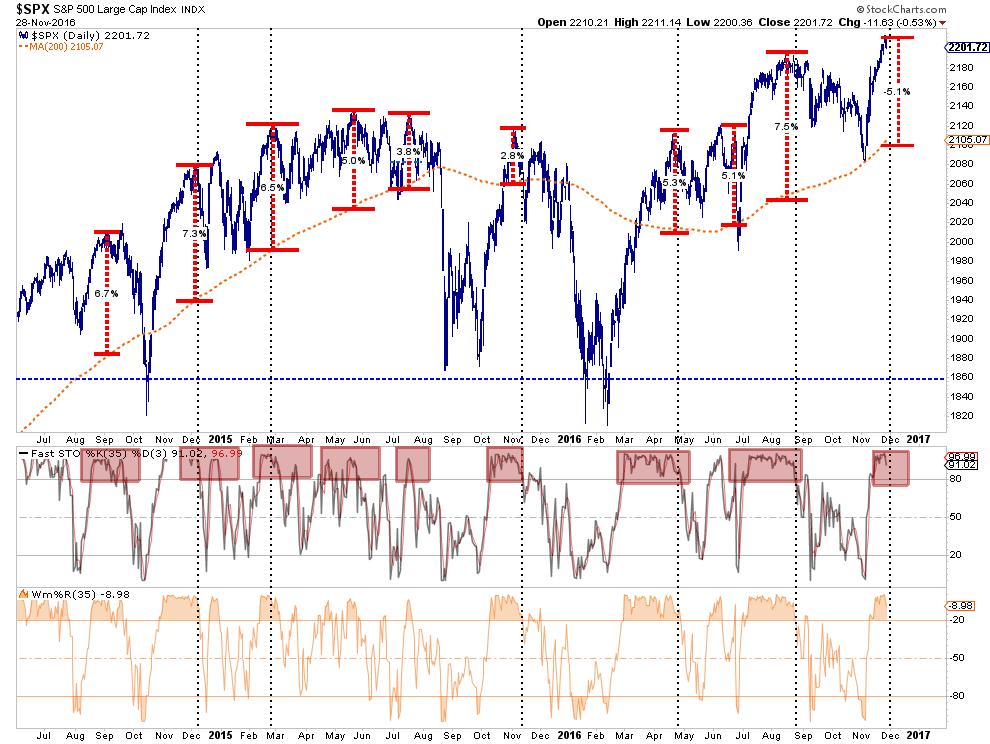
As with the discussion of the 3-standard deviation of the market above, the current deviation from the long-term average is also consistently with a late stage move that will need to be corrected. As discussed many times previously, a moving average only exists at a point where previous prices have traded both above, and below, certain levels. Therefore, moving averages exert a “gravitational force” on prices which grows in strength as prices deviate further away from the average. As shown below, despite beliefs that prices can only move higher, there is an extreme regularity of “reversions back to the mean” over time.
Currently, with prices pushing a 5% deviation from the longer-term average, it is only a function of time until a reversion occurs back to, if not beyond, the 200-dma which currently resides around 2105.
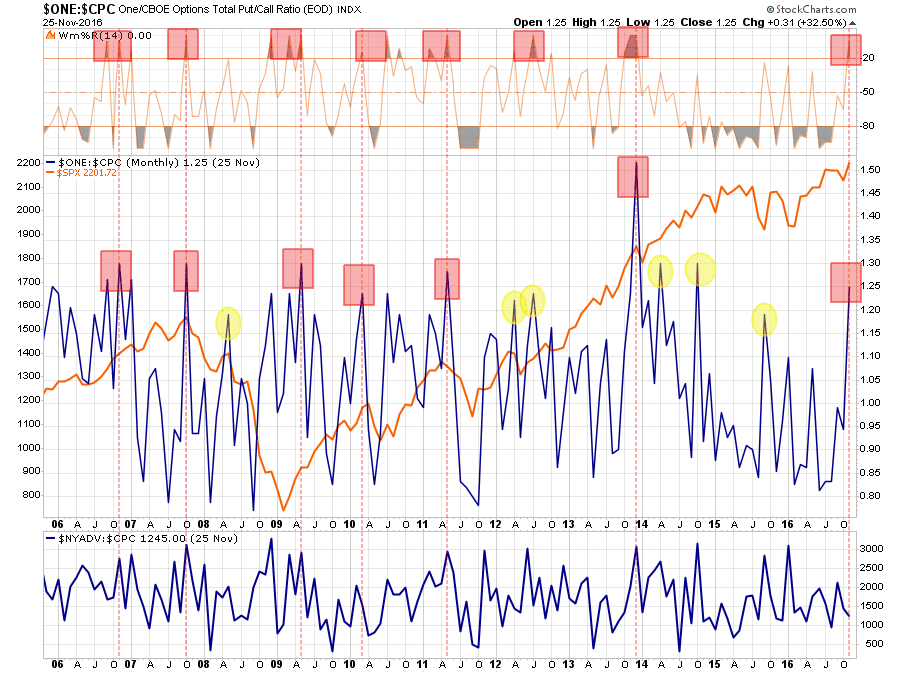
Furthermore, the rally from the pre-election lows has been a massive short-covering squeeze as markets were hedging a “Trump” win as bad for the markets. The ramp up in the market caused shorts to be frantically covered as Wall Street quickly reversed their message from “Trump The Horrible” to “Trump The Great.”
As shown below the current put/call ratio has quickly reverted to levels that have historically been associated with at least short-term market peaks as well as major market corrections.
Lastly, as I addressed last Tuesday, the combined rise in the US dollar and 10-year interest rates is a combination that has historically not worked out great for investors but is currently being ignored. To wit:
“The chart below is the 60-day moving average of total 60-day change of both interest rates and the dollar. In other words, I have used a 60-day moving average to smooth out the volatility of the 60-day net change in the dollar and rates so a clearer trend could be revealed. I have then overlaid that moving average with the S&P 500 index.”
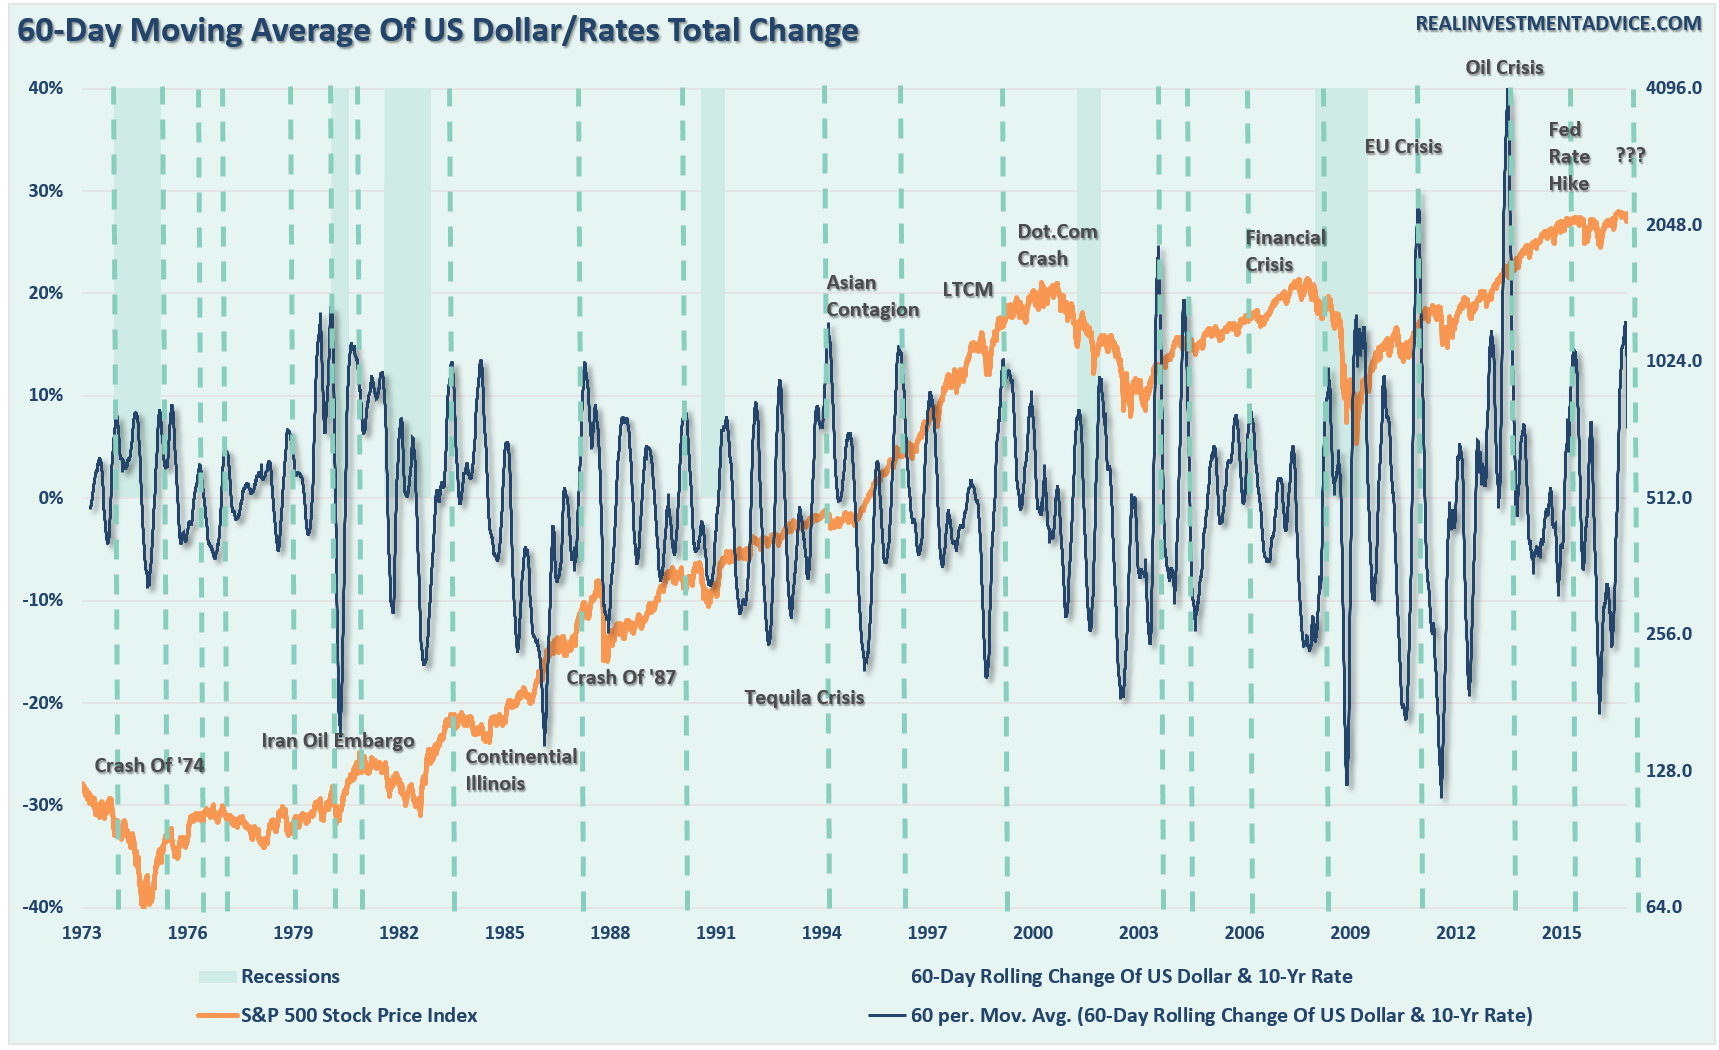
“Not surprisingly, since stronger rates negatively impacts economic growth due to increased borrowing costs, and a stronger dollar reduces exports and ultimately corporate earnings, markets tend not to like the combination of two very much.”
As shown in the last chart below, whenever LIBOR, and the 10-year rate has increased, it has led to an economic, currency or market-related shock. These shocks have tended to negatively impact investors on both a short and intermediate-term basis.
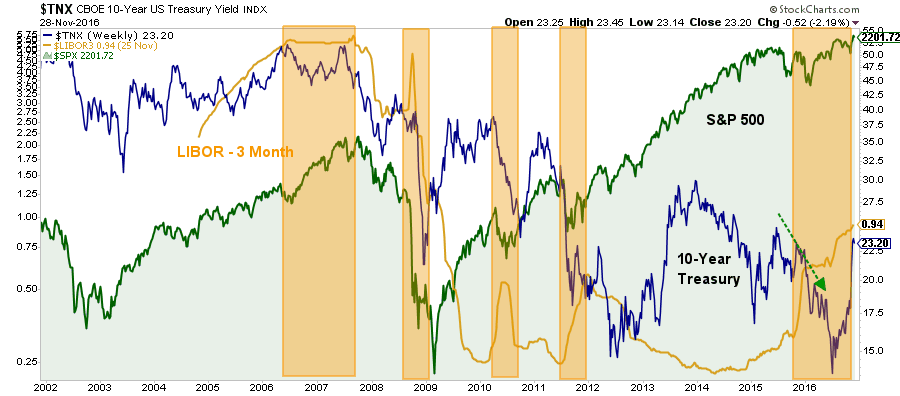
While such an event has not occurred as of yet, it does not mean the impact of a strong dollar and higher rates should be summarily dismissed. The negative impacts to both corporate earnings, as well as economic forecasts, can quickly spoil the “bull market party” particularly given the level of valuations that currently exist.
As I stated last week:
“Importantly, with next week (Thanksgiving) being a light trading week, it would not be surprising to see markets drift higher.
However, expect a decline during the first couple of weeks of December as mutual funds and hedge funds deal with distributions and redemptions. That draw down, as seen in early last December, ran right into the Fed rate hike that set up the sharp January decline.”
I still expect such could very well be the case with a “Santa Claus” rally into the end of the year as fund managers scramble to add performance before the year-end reporting period comes to an end. This would certainly coincide with the “hope” that investors have currently built into the market during the recent advance.
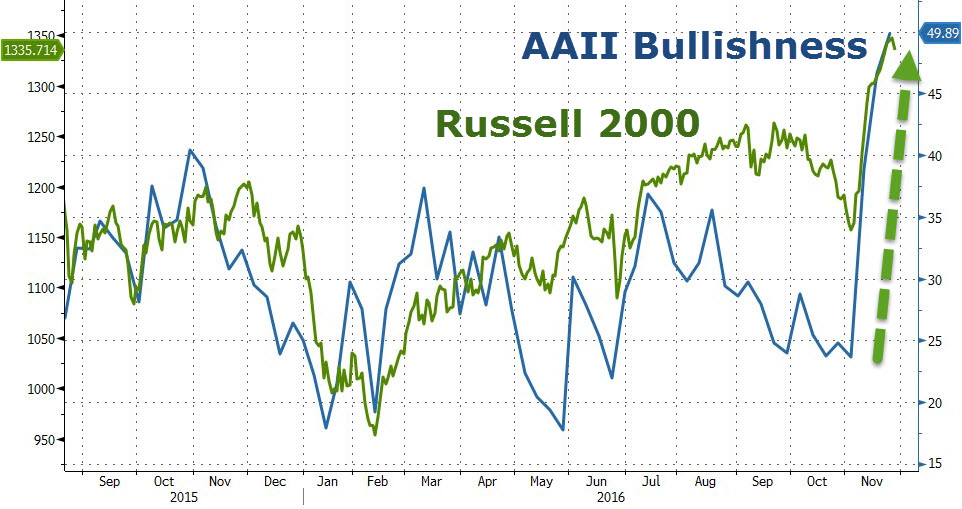
“The greatest streak of stock market gains in almost 28 years may have some wondering if it is sustainable, but, according to AAII, this objective spike in valuations following Donald Trump’s victory has sparked overwhelming bullishness among investors.
15 straight days of gains in Small Caps (only bettered by 1988’s streak) has sent AAII bullishness soaring to its highest since January 2015 (following the end of QE3) with the biggest 3-week spike since September 2010.”
You don’t have to look back very far to begin to get an idea of what happens when investors have come to grips with reality versus “hope.”
This analysis does not necessarily suggest a major market crash is imminent. However, it also does not suggest a major advance directly to 2400 is in the offing either. The point to be made is the risk of a corrective action, which could provide a buying opportunity provided important support levels hold, is likely in the short term.
Given that most individuals have not even gotten “back to even,” given the drag from interest rate sensitive investments, this may be a good opportunity to rethink allocations and make some decisions about the inherent level of risk in portfolios.
In other words, if you are supposed to “sell high,” and “buy low,” there are certainly many short-term indications which suggest this may be an apropos opportunity to take some profits and rebalance risks accordingly.
Or, you can just “hope” it will all turn out okay.

The post Weak Links In The “Trump Rally” appeared first on crude-oil.top.