Submitted by Lance Roberts via RealInvestmentAdvice.com,
Last night, President Obama took the stage at the Democratic National Convention to throw his support to Hillary Clinton in her bid for the Presidency. He also took the opportunity to take a victory lap for his economic achievements while in office.
With the 2016 Presidential Election fast approaching, this was one of the final chances the President will have to try and divert attention away from Hillary’s “trustworthiness” problem following continued revelations surrounding Benghazi, email scandals and the Clinton Foundation which is now under investigation by the IRS.
The problem for the Democrats currently, following a rather severe beating at the polls during the 2012 mid-terms, is the broad loss of faith in “hope and change.” With Donald Trump and Hillary Clinton virtually tied in the majority of polls (within a margin of error), it is imperative to regain those voters. Not surprisingly, since voters tend to “vote their pocketbook,” it wasn’t a shock to hear the President spin a decisively positive economic picture during his speech. He hopes that by pointing to falling unemployment rates, economic growth and higher confidence levels; it will give voters a sense of confidence in the President’s accomplishments and be convinced the expect the same for Hillary.
The question is whether the majority of the voting public will agree with the President’s message? Let’s take a look at some charts.
Government Debt
Since 2009, Government debt has surged by $7.8 Trillion and by the end of the next budget cycle will likely surpass $20 Trillion in total. The problem is that during the current Presidential term, real economic growth has risen by just $2.09 Trillion. However, even this number is inaccurate as the current government debt levels do not include other liabilities of the government such as social security and other social welfare programs.
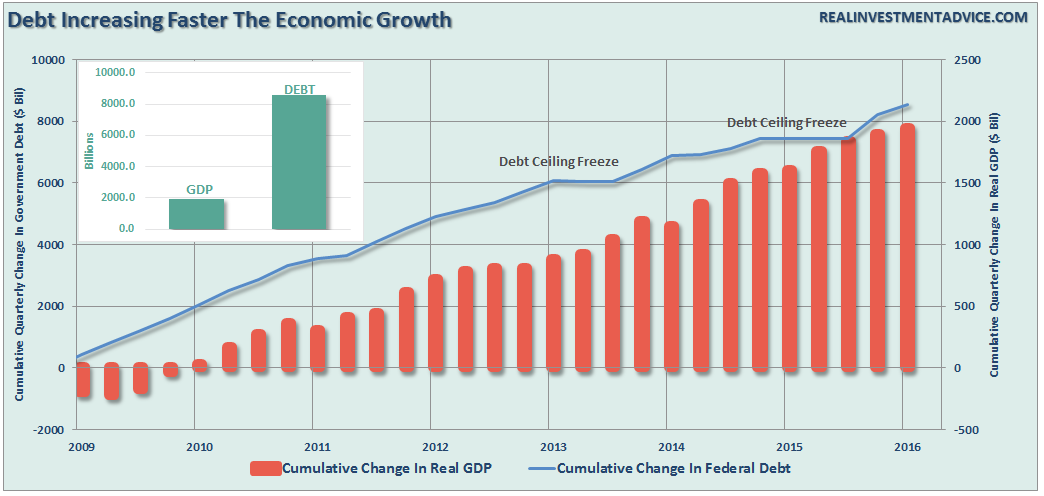
The following chart quantifies it a bit better when you look at cumulative increases in debt and real, inflation adjusted, GDP.
Yes, the economy is growing, however, that growth has come at a huge cost of a debt burden that will be amplified if borrowing costs rise with anticipated increases in real interest rates. Of course, this is entirely ironic considering it was President Obama himself who admonished the previous administration’s increase in debt which he conveniently forgot to mention during his self-congratulatory speech.
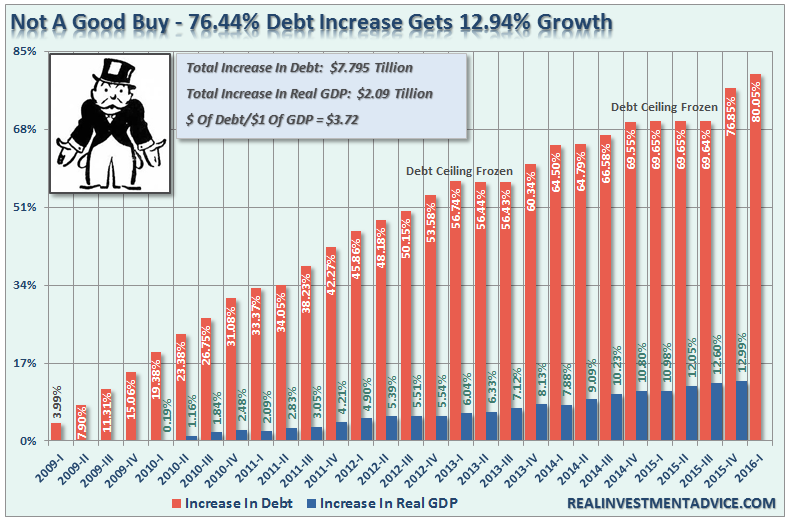
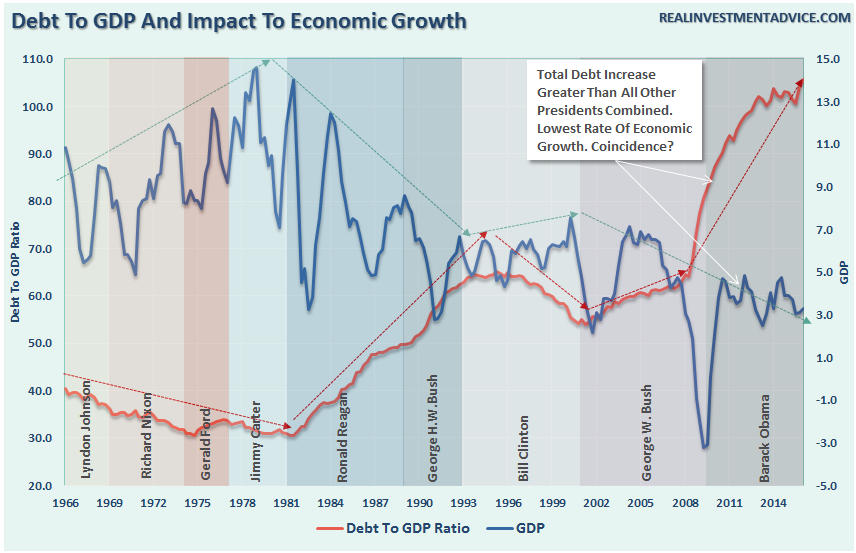
The problem is this. There is a direct correlation between the expansion of debt and economic growth. Debt detracts revenue from productive investments that lead to economic growth and diverts it into non-productive interest payments. This is why the explosion in the amount of debt required to generate economic growth (currently $3.72) is unsustainable longer term.
Employment
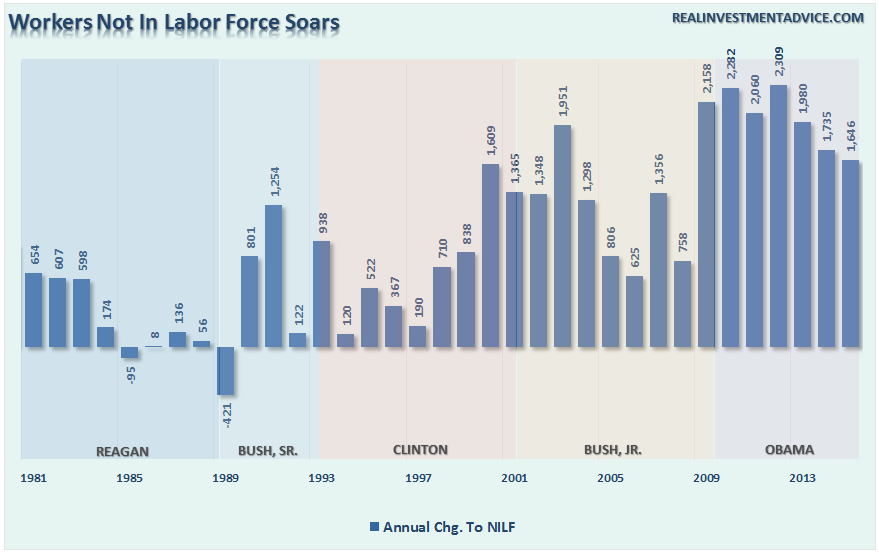
The President also boasted the creation of 14 million jobs and historically low unemployment rates as a sign of his success. While the current Bureau of Labor Statistics employment reports do currently show the unemployment rate around 5.0%, that number is obfuscated by the more than 94 million workers that are currently not counted as part of the labor force.
As I have discussed many times previously, when it comes to economic strength it is full-time labor that leads to household formation and higher consumption.
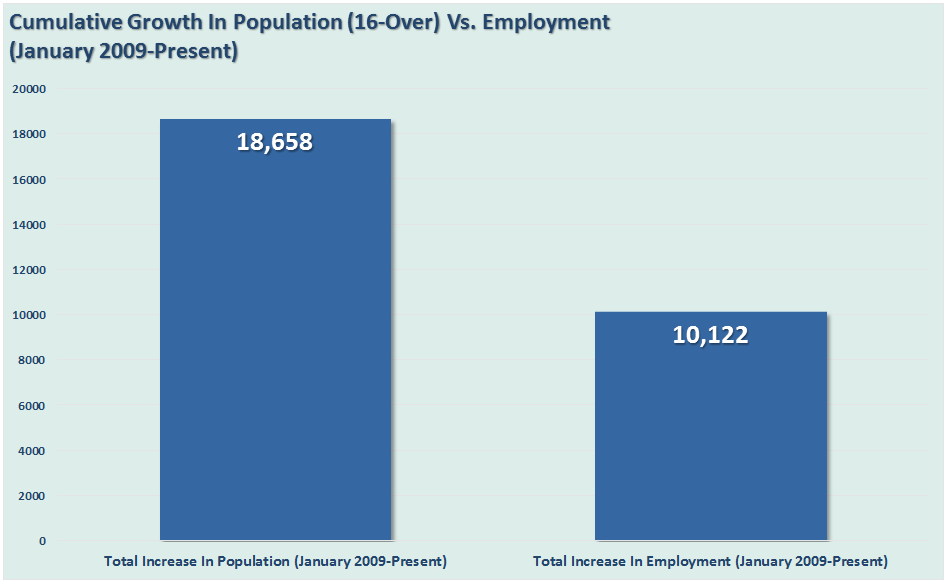
Furthermore, the rate of employment must be faster than the rate of population growth, otherwise, you are just treading water. The chart below shows the amount of full-time labor as a ratio of the working age population. (I have excluded all individuals over the age of 55 to quell the argument of “baby boomer” retirement. Those between the age of 16-54 should be working if we are indeed nearing true levels of “full employment.”)
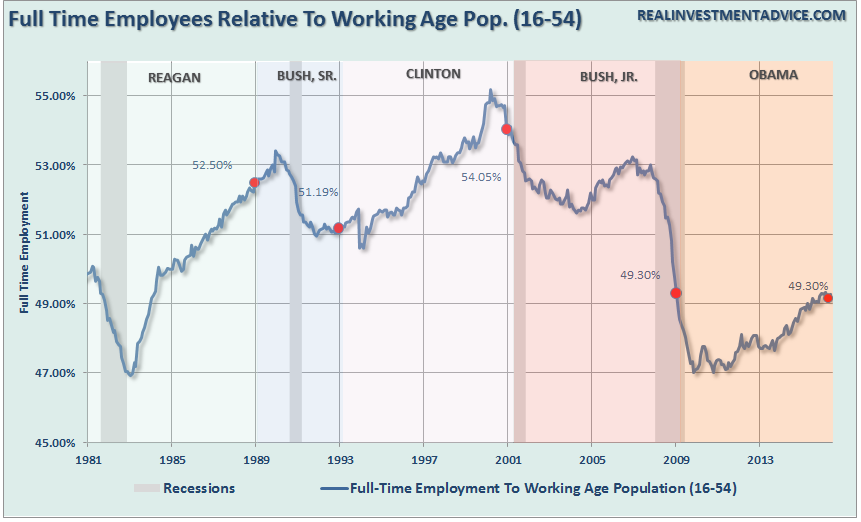
Currently, 49.3% of the population is employed full-time which is the same rate as when the President entered office.
Furthermore, the actual number of jobs created is roughly 10 million rather than the 14 million as touted. That is because he is only counting employment from the bottom of job losses rather than from the time he entered office. Also, as noted above, the employment ratios are deceiving when you realize that the population has grown faster than employment leaving a rising number of individuals no longer counted as part of the labor force. In other words, the majority of jobs created have just been a function of the incremental increases in demand driven by population growth rather than a stronger economy that benefits the wealth of the majority of the population.
As stated above, when the employment-to-population ratio or the labor-force participation rate is discussed, the plunging levels in these ratios are often dismissed simply as a function of the “baby boomers” heading into retirement. However, if we factor out those individuals by only looking at the employee-to-population ratio of 16-54 aged individuals as a percent of that age group the picture fails to improve.
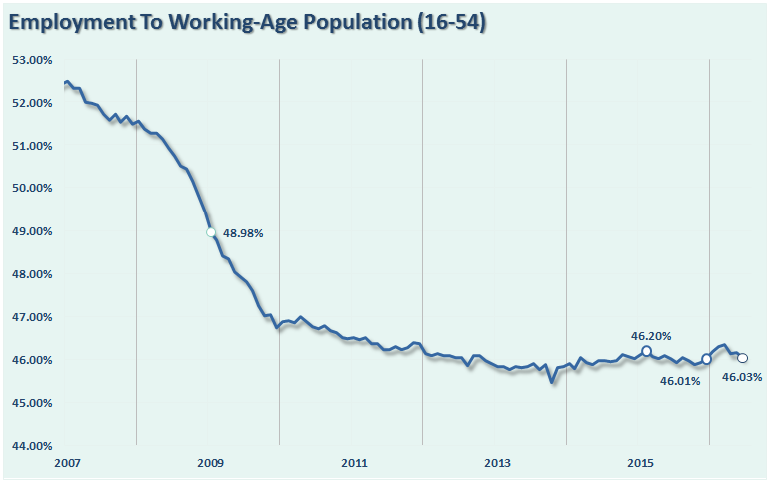
While the unemployment rate has certainly plunged according to governmental measures, one would be hard pressed to find 95.0% of the population that “wants to work,” actually working.
Personal Incomes
The annual rate of change in personal incomes has been on a decline since the turn of the century. This is a function of both the structural shift in employment (higher productivity = less employment and lower wage growth) and the drive to increase corporate profitability in the midst of weaker consumption.
The chart below shows the disparity between corporate profits and employment and wages.
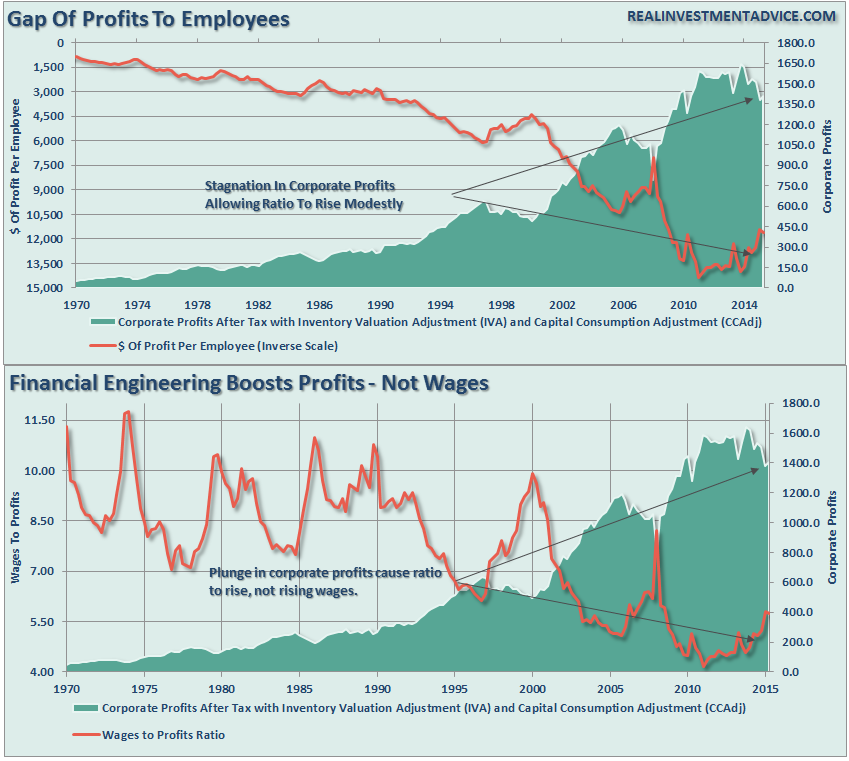
While corporate profitability has surged since the financial crisis, those profits have come at the expense of employees. Since 2009, wages for “non-supervisory employees,” which is roughly 83% of the current workforce, is lower today than when Obama first took office. This is where voters are most sensitive when they vote – their pocketbook.
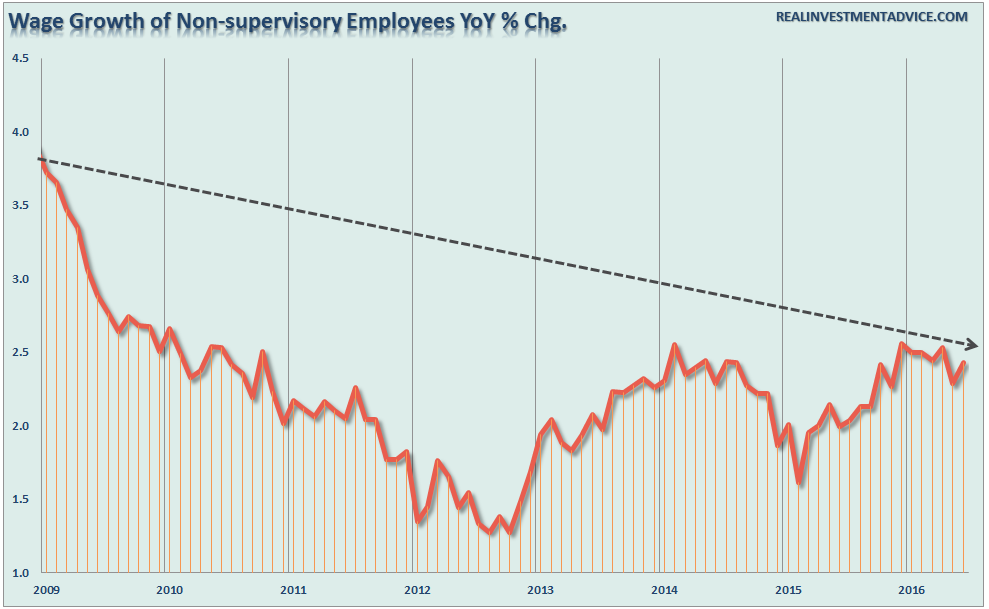
The problem with this, of course, is that the real cost of living continues to rise.
Government Assistance
Of course, the issue of declining incomes and rising “income inequality” is really best shown by the level of social benefits as a percentage of disposable incomes today. Today, roughly 1-in-3 households receive some form of government assistance.
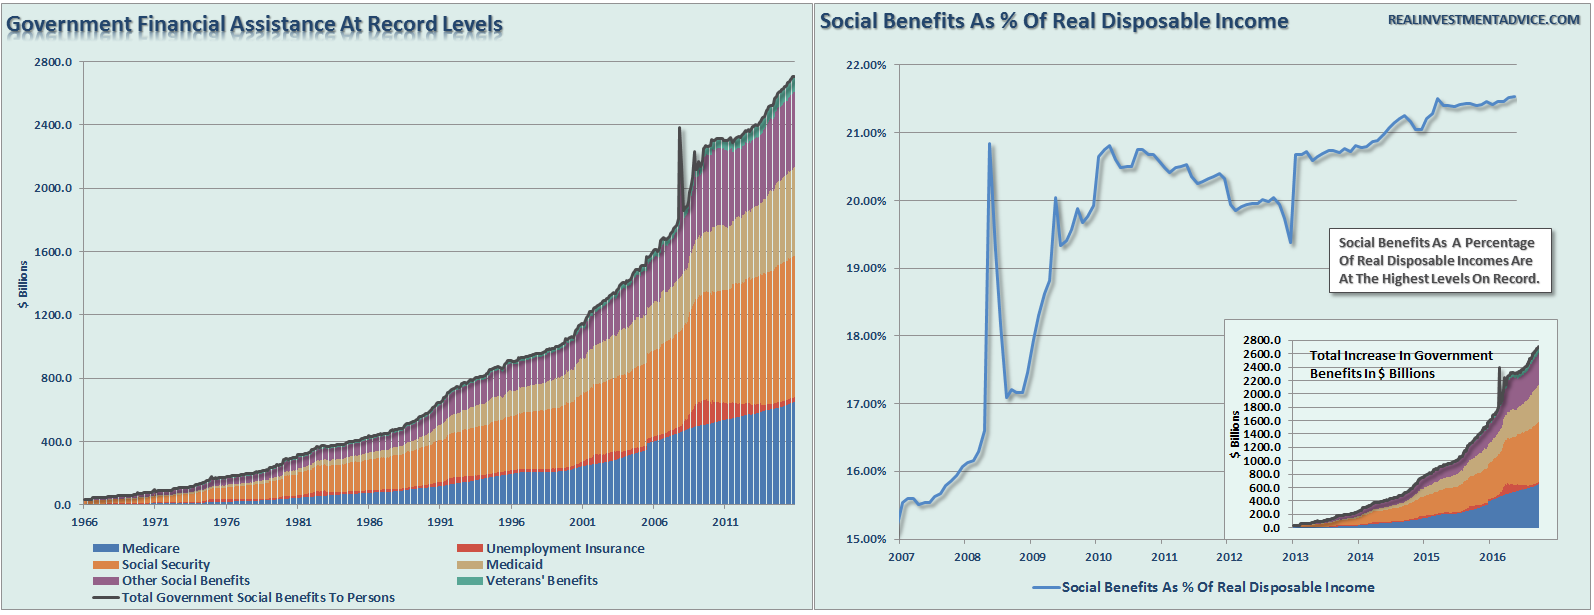
It is here the President’s economic victory lap is most challenged. While he will point to rising asset prices, improved headline employment numbers and economic growth as reasons to be “optimistic,” with almost 80% of the country living roughly paycheck-to-paycheck it will be a hard argument to win.
Furthermore, as noted above in relation to the unfunded liabilities of the social welfare programs, the real problems are still coming.
“According to the recent report from the Social Security Board Of Trustees the two main trust funds, OASI (for ‘Old Age Survivors Insurance’) and DI (‘Disability Insurance’) are in trouble and DI actually went bust several months ago.
Among the other programs slammed in the report, the Hospital Insurance (HI) fund, one of Medicare’s major trust funds, is of particular concern. HI is going to completely run out of money in 2028, just twelve years from now which is two years earlier than they had originally projected.
Furthermore, they project the entire Social Security program will be fully depleted six years later in 2034.”
Of course, the unfunded liabilities of Social Security and Medicare are not a problem…until they are.
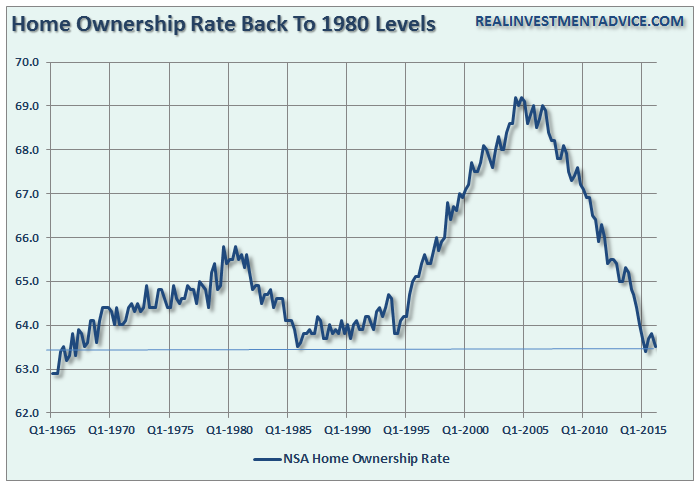
Housing
When it comes to the economy, it is home ownership that is the reflection of economic well-being. Since 2009, the government has poured trillions of taxpayer dollars into the housing market to try and increase activity. The effect of those injections has been marginal, to say the least.
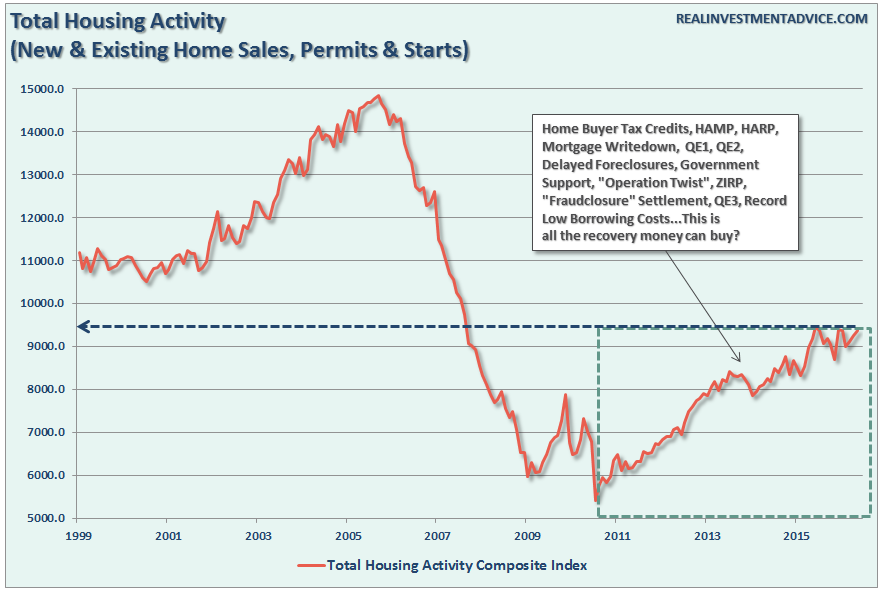
However, as I stated above, it is ultimately household formation that leads to higher levels of consumption and stronger economic growth. As I discussed at length on Monday, the current recovery, as shown in the chart below, was NOT driven by individuals buying homes to live in, but rather speculators buying homes, primarily for cash, and turning them into rentals.
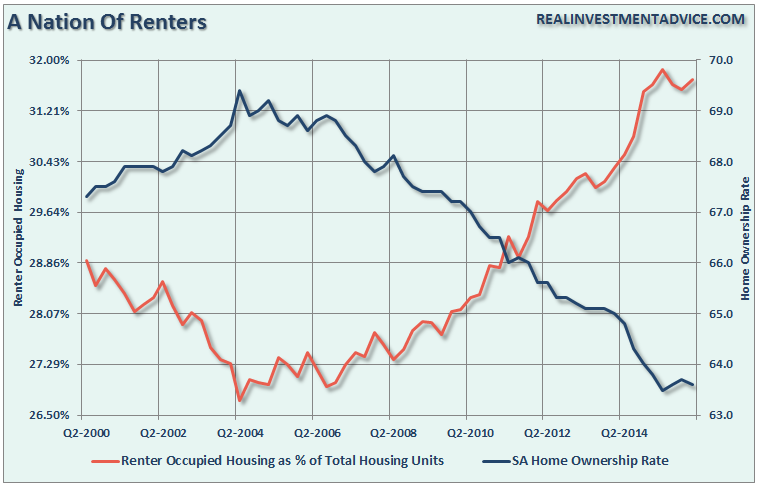
With homeownership currently near its lowest levels since the early 1980’s, it does not suggest a resurgent economy is in the making.
Economic Prosperity
However, it is the economic prosperity of an individual that truly determines how they will vote at the polls. A recent Fed Reserve survey of consumer finances shows the real disconnect between Wall Street, the President, and Main Street’s economics.
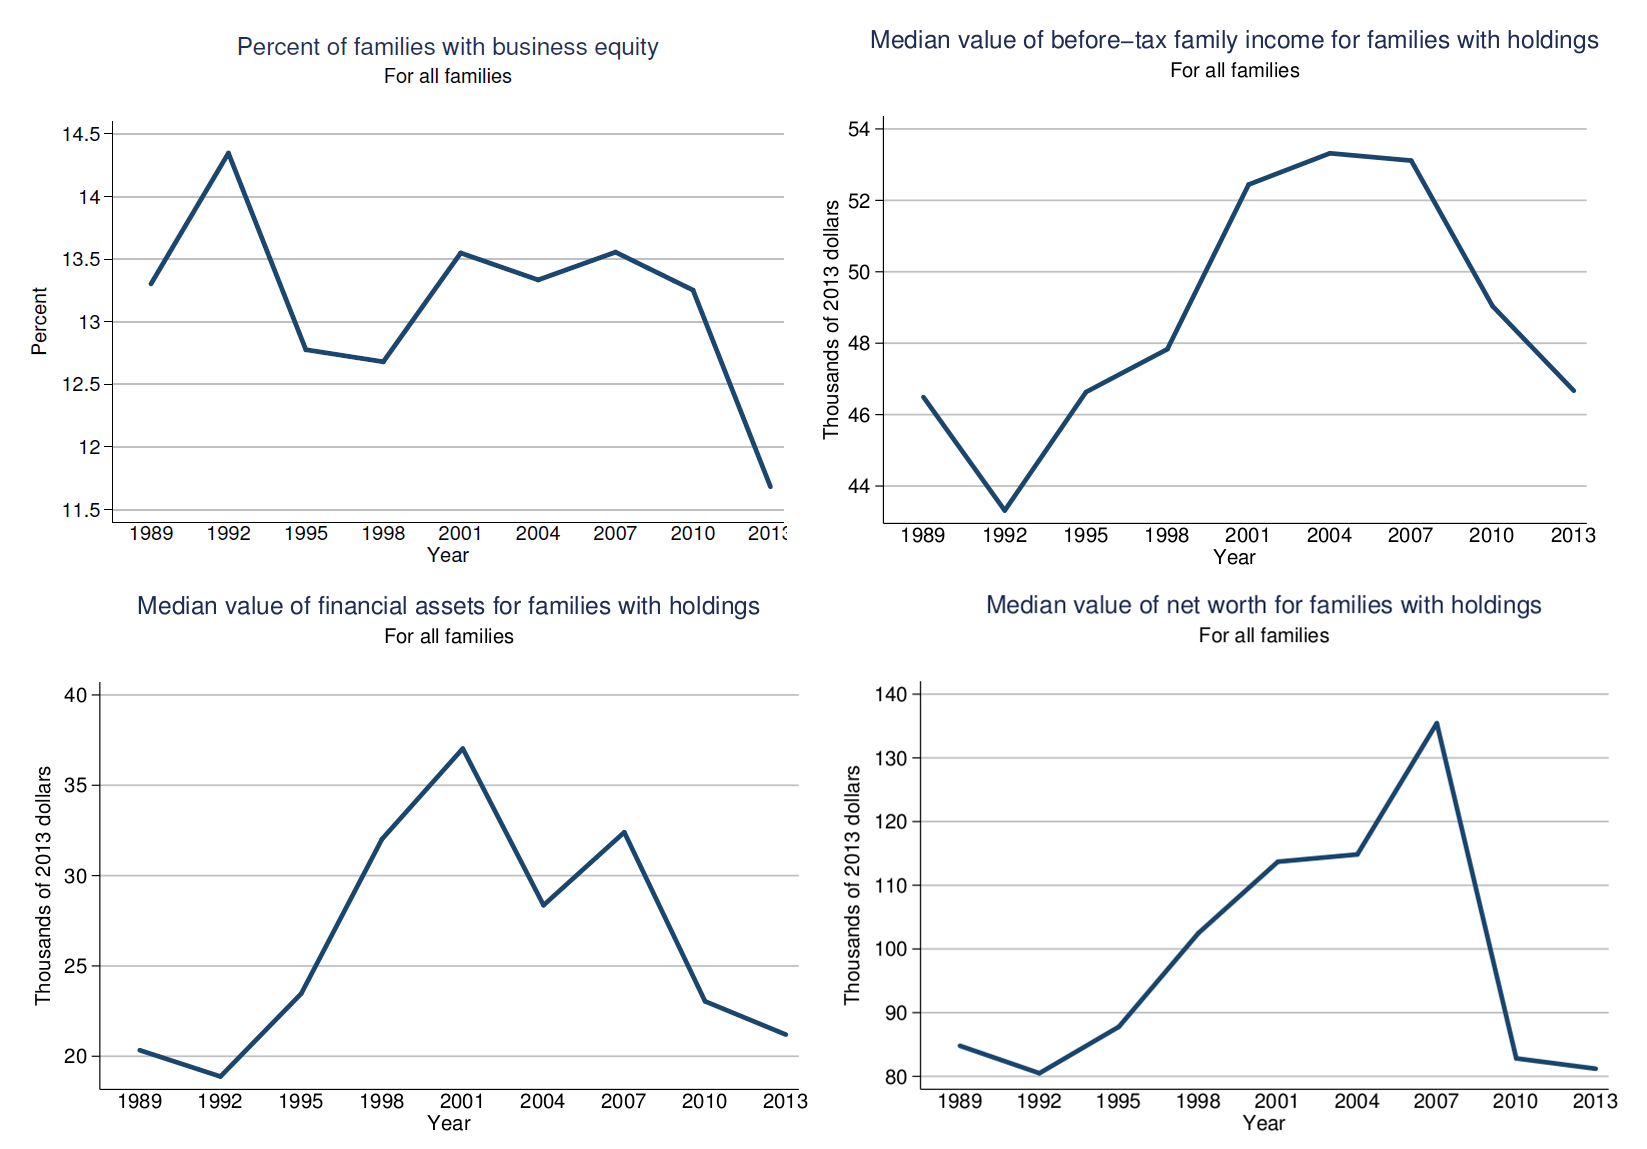
With net worth, incomes, financial assets and business equity ownership at levels substantially below where they were when the President took office, it is not surprising that the Administration is focused on trying to justify their record.
While the data, as reported by government agencies, has been massaged, tweaked, and recalibrated to provide a more optimistic output, it is hard to fudge the economic standards by which the majority of the country lives with. Like a game of “Civilization,” the rise of Bernie Sanders and Donald Trump have sent a pretty clear message that the “serfs” are not happy in the “kingdom.”
While the President did his best to put a positive spin on the current economic environment, and the success of his policies, to “get the vote out” for Hillary Clinton, it is not likely to sway the populace by much.
As with all things – it is the lens from which you view the world that defines what you see. For Wall Street, things could not be better. For Main Street, most everything could be better. In the meantime, Hillary Clinton has a lot of “convincing” to do if she expects to change voter’s attitudes between now and the 2016 Presidential election.

The post Why MainStreet Isn’t Buying Obama’s Economic Story appeared first on crude-oil.top.