
Can I still get into EURUSD Short and make profit? YESSS!!!!
Dear Friends,
I have recently published an idea for Shorting EURUSD with potential 220 pips of profit. Please see “Related Ideas” below.
As you can see this trade is like 75% in profit however price got to a different level of supports and Fibo which I will review later in this post. However; there has a beautiful price action in EURUSD and some underlying markets that I would like to share my thoughts with you. If you liked it please write a comment and Like the idea!
We will review the followings in this post:
A) The most recent EURUSD price action
B) Underlying EURO markets
C) Underlying USD markets
A) The most recent EURUSD price action
See the following wedge formation which is formed during 36 hours. Pay attention to the points where the price has touched the upper and lower band of the wedge . If you are new into forex try to find the same formation in other markets or in different time frames.
The above chart is 15 min EURUSD
If we go to shorter time frame we can even see that there are 2 H&S formations sitting at the lower band of the wedge .
Draw the neckline on your chart and extend it to the right. Wait for the neckline to be broken, and then sell EU.
B) Underlying EURO Markets
In this section we review the major markets in EUOR region.
First let’s look at the weighted average EURO . You can make the same chart on you watchlist. Just see the formula on the screenshot title and just type that on your watchlist search box.
Months ago I mentioned in my posts that weekly RSI for weighted average signals a significant bearish market. See whether you could have expected this EURO bearishness by only looking at the RSI? This is what you could see at that time.
Very clear, right? Use RSI for your analysis particularly for weekly charts. Then see what happened next.
and it is an astonishing price action on weekly time frame if I zoom in. Guess why?
1. Bearish engulfing 2) Bounded off the EMA 14 and 21 (Always use these two) 3) Bounced off the Rising trend line .
Friends EURO bearishness has just started. Can you see that? We do not need anyone to tell us that. It is clear.
Also do not forget TRIPLE top
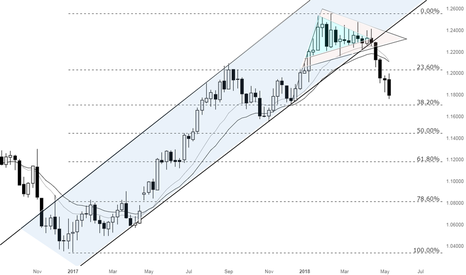
And why not looking at the monthly? The EURO bearishness is just started right? Even if it is going to visit only EMA 14 we have a few hundred pips to earn.
Also remember that on 17/05/2018 EURO did not make a lower low and it is only an Inside Bar . Therefore the bearish move is not ended. Also if you wonder why EURO did not in the last session, it is because the main FIB level. See the red line. After this red line our target will be 1.17.
Next chart I would like to review is Euro future. Remember to replicate you need to just type the screenshot title on your watchlist search box.
See where we are now!
And if I zoom in, you will see the beautiful bearish engulfing candle that is forming now. The candle is still open but very likely to close like this due to not having any major risk event on tab.
You may ask that will the weekly candle closes below the rising channel and blue wedge? I would say most likely yes. See a shorter time frame price action. See how this rising trend lines acting as stronger resistance.
Remember that the last two daily candles closed outside the wedge and channel. If this break is a true break, as the weighted average suggested, then you can imagine there is no support to stop Euro futures too as these candles