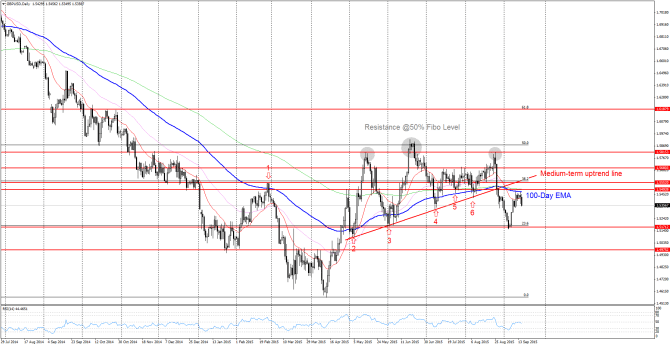
GBP/USD (daily chart as of September 15, 2015) broke down below the 100-day EMA (bold blue moving average line on chart) on August 26 with a long bearish candlestick. This 100-day EMA has been serving as major support/resistance line since late February (red arrows from 1 to 6 on chart). On August 27, the pair also broke down below the medium-term uptrend line connecting the lows since early May (bold red trend line on chart).
Read the rest of the article GBP/USD under Pressure below 100-Day EMA