General overview for 25/01/2017:
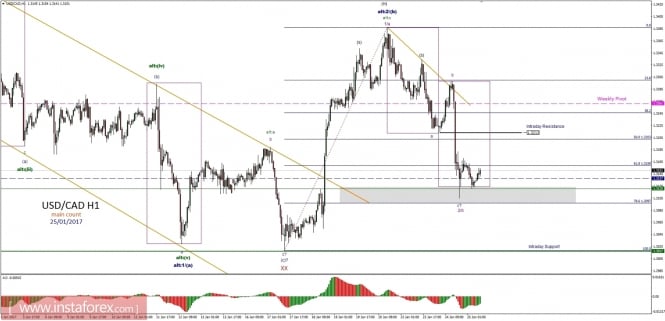
The 78%Fibo at the level of 1.3097 was almost hit and this might be the bottom for the wave c (purple) of the overall corrective cycle. The market is currently trying to test the intraday resistance at the level of 1.3213. Only if this level is clearly violated, the low is in place. The next hurdle will be the golden trend line resistance around the level of 1.3245. Only a sustained breakout below 1.3087 level would invalidate this bullish view.
Support/Resistance:
1.3018 – Technical Support
1.3137 – WS1
1.3189 – Technical Support
1.3252 – Intraday Support
1.3261 – Weekly Pivot
1.3386 – Intraday Resistance
1.3507 – WR1
Trading recommendations:
The head and shoulder pattern might be completed. If the golden trend line is clearly violated, then only buy orders should be opened with SL below the level of 1.3212 and TP at the level of 1.3386.
The material has been provided by InstaForex Company – www.instaforex.com
The post Technical analysis of USD/CAD for January 25, 2017 appeared first on forex-analytics.press.