As expected, the Dollar index got rejected at the 101.60 resistance where the Ichimoku cloud was formed. The rejection has pushed the index towards 100.20 for a new lower low. Remember from our last analysis that since the latest low was confirmed by the RSI, a new low was expected.
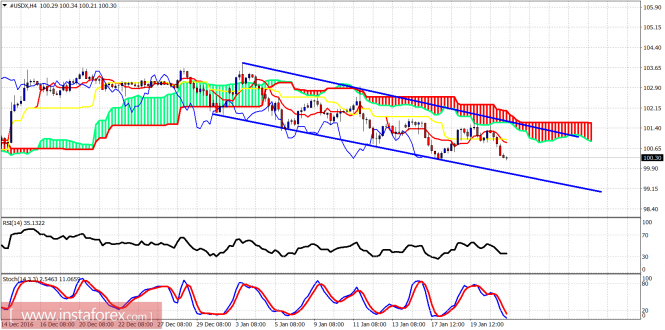
Blue lines – bearish channel
The Dollar index remains in a bearish trend inside the bearish blue channel and below the Ichimoku cloud resistance. A reversal could be expected once price reaches the lower channel boundary near 99.70. Resistance is at 101.50. If broken, we should expect the Dollar index to start a new up trend for new highs.
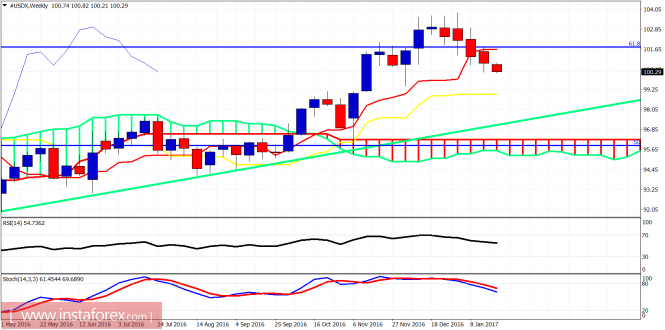
Green line – long-term support trend line
Last week I said that the rejection at the tenkan-sen (red line indicator) would be a bearish sign. I could see this downward move continue lower towards the kijun-sen (yellow line indicator) but Dollar bears should also use tight stops. Another early week bounce should not be ruled out.
The material has been provided by InstaForex Company – www.instaforex.com
The post Technical analysis of USDX for January 23, 2017 appeared first on forex-analytics.press.