![]()
![]()
![]()
Stock markets have been on a good run since late March, with the FTSE bouncing back around 20% from its lows to within a whisker of 6,000.
UK100 (FTSE 100) Daily Chart
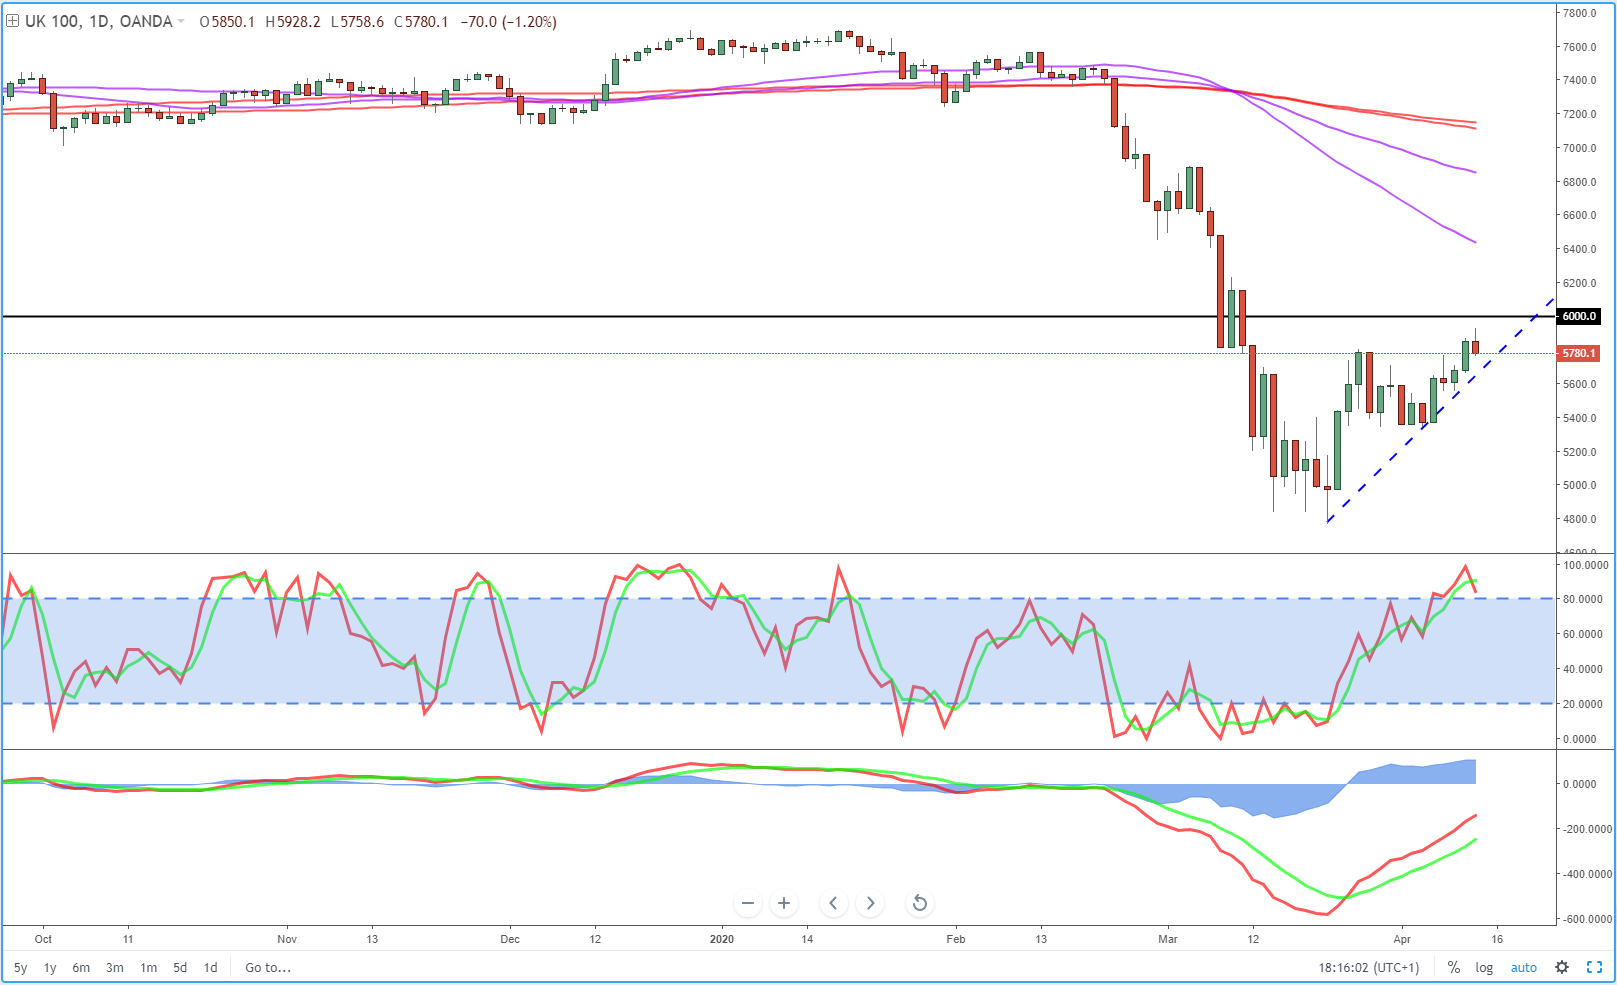
OANDA fxTrade Advanced Charting Platform
The rally looked to be running out of steam around 5,800 but a late surge on Thursday, backed by momentum, quickly changed that. Unfortunately though, we’ve since seen a bearish engulfing pattern on the 4-hour chart which begs the question, is 6,000 a step too far? Is there really good reason to be this optimistic as we head into the most horrific earnings season in years, probably decades?
UK100 (FTSE 100) 4-Hour Chart
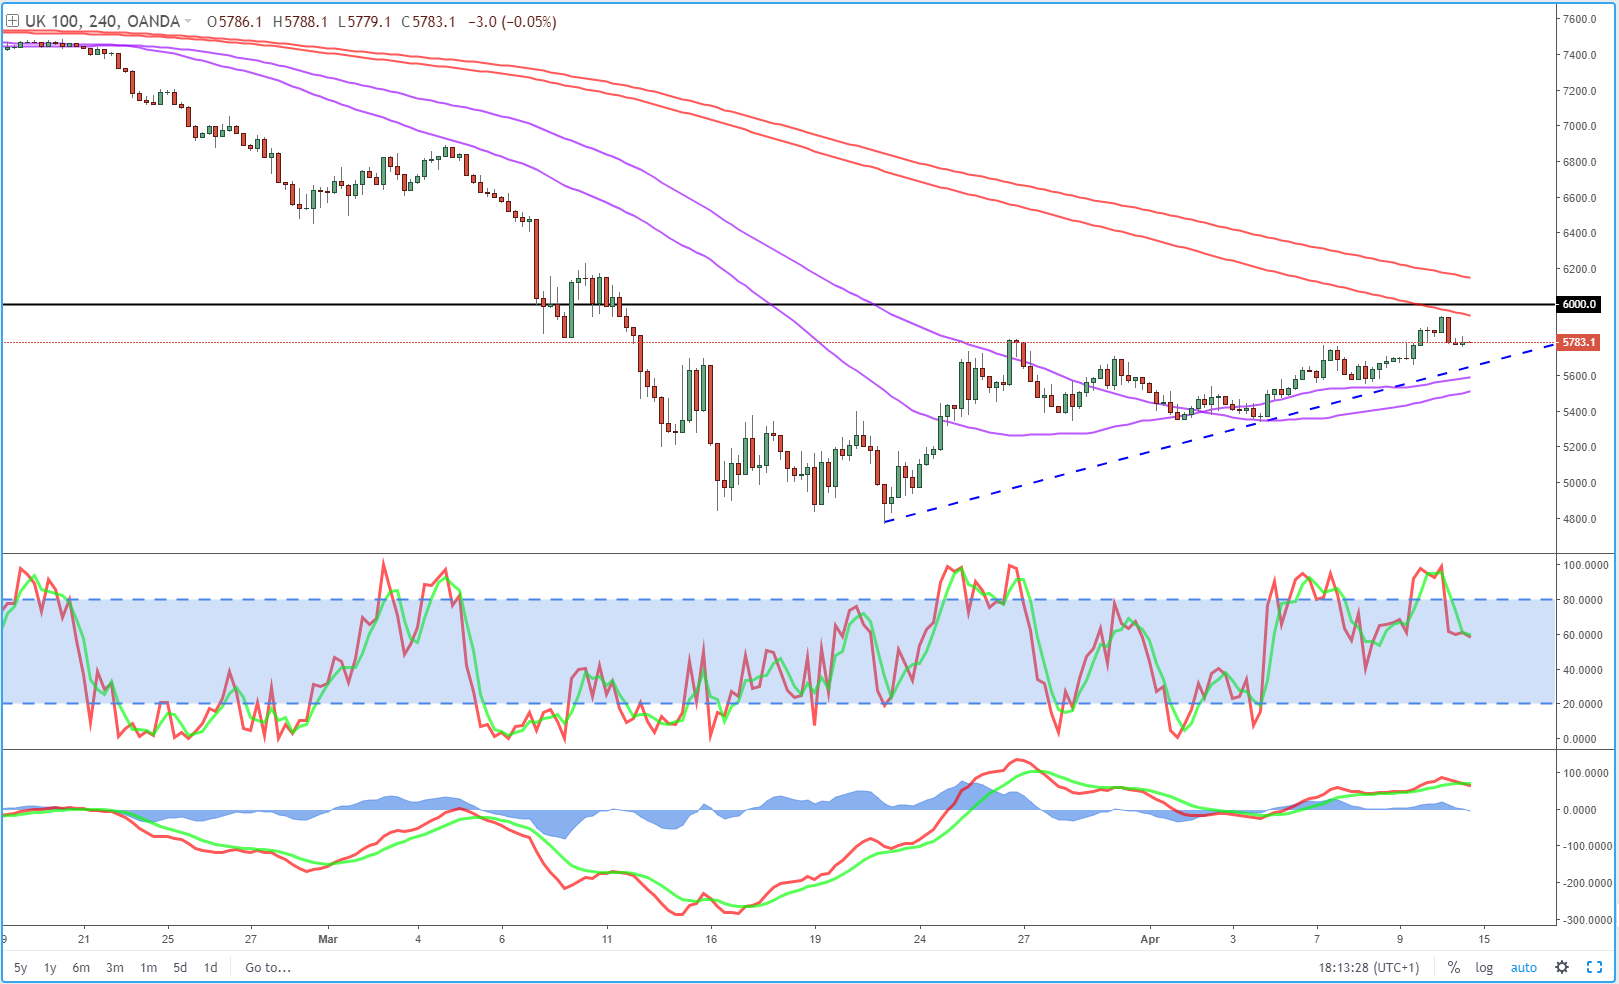
The momentum indicators will be key for me here but a break would send a strong signal and suddenly 6,200 doesn’t look too far away, where it found resistance last just over a month ago.
The big level above here though is 6,500. That may be a step too far at this stage, although a lot of bad news seems to be priced in – based on the free pass the horrible data we’re seeing is getting – and there is an unprecedented amount of stimulus floating around this system. The usual rules may not apply. Earnings season will be the true test of this.
A break below the rising trend line (granted – only two touches, but useful none-the-less) may signal that some profit taking has kicked in and patience is needed. If so, that’s fine, it’s been an impressive rally under these extreme circumstances.