Submitted by Jeffrey Snider via Alhambra Investment Partners,
One of the articles referenced in Janet Yellen’s Jackson Hole speech last week was a piece written for the Peterson Institute for International Economics by Senior Fellow Olivier Blanchard. Dr. Blanchard has, as noted earlier today, all the “right” credentials, which is why his conjecture gets included into the speeches of Federal Reserve Chairmen. Having taught at both Harvard and MIT, becoming chair of the economics department at MIT for five years, landed Blanchard the role of research director at the IMF. Private experience is obviously missing from his resume.
Dr. Blanchard’s article was an attempt to “explain” the yield curve in the United States. Economists like Blanchard are so indoctrinated in central bank and QE mythology that what is exceedingly simple is dismissed as impossible. Persistently low interest rates are proof of “tight” money in the real economy; but that just can’t be with QE and all the amassed central bank intellectual capacity in that area. Instead, they must make the most absurd arguments to try to square a circle of their own often circular logic or paradoxes (central bankers know everything about money but now central bankers are stumped, therefore it can’t be money?).
You can read his whole argument and decide for yourself, of course, as I will only highlight but one of three reasons he specifies as really a window into this academic divide. One of the primary correlations in this view, which isn’t necessarily consistent with actual data, is that low rates are a function of low productivity and expectations for continuing low productivity. Blanchard tries to argue that while the crash in 2008 might explain the lack of productivity in the immediate aftermath, it doesn’t do much to render understanding about why it appears to have lingered.
To have become permanent, he contends, is the partial responsibility of “gloom”; I’m not making this up. He actually writes, “I believe that this bad news about the future largely explains the relative weakness of demand today.” And that sets up what is a very good example in how economists think not about the economy in which we all live but the “economy” where models prevail.
It is useful to play with some numbers here. Suppose that you learn that your income over the next 30 years will rise at 4 percent rather than at 5 percent as you expected earlier (because income typically increases with age, individual income typically increases faster than aggregate income). This represents a roughly 20 percent decrease in the present value of your future earnings, and is likely to lead you to consume say 10 percent less. If this realization comes to you over a period of five years, you will decrease consumption by 2 percent each year relative to your income. Returning to aggregate implications, as consumers adjust their expectations the way you do, consumption growth will be weak. The same argument applies to investment. The lower the expected growth rate of profit, the lower the desired level of capital, and this in turn will lead to a period of low investment until the new lower level of capital is reached.
Nobody but an economist would think like this; and while this example is meant as a means to translate a very real phenomenon into the math-speak of regressions that academics use, he is seemingly unaware of the translation and thus the potential for error in even attempting it. In the world of high-credential universities, actual phenomenon must be converted into linear functions. That means that “gloom” has to be accounted for across several variables that can be each modeled in such a way that it makes sense to the mathematical versions of reality (and thus to economists who think I equations first).
Any non-indoctrinated non-statistician can immediately recognize the problems with thus thinking math-first. If you need to translate the real world into nonsensical linear mathematics before you can attempt to understand said world, then the bond market will really be a mystery to you.
In the world of the real, businesses don’t invest because their revenues don’t expand; end of story. Revenues aren’t expanding because businesses won’t hire no matter what the unemployment rate says; end of story. This was all, of course, one of the factors that quantitative easing was meant specifically to address – derived from the statistically modeled understanding of expectations rather than the actual conditions of them. The “wealth effect” was supposed to break the economy out of any gloom, as rising asset prices, especially the repeated and emphasized “record highs” of stocks, bonds, or anything in between, would surely negate any immediate “gloom” as it rolled over into expectations of an impeccable future.
Economic theory just does not allow for the possibility that asset prices, particularly stocks, are anything but completely efficient. But that is increasingly what we find, even in the math of orthodox construction. As noted earlier, the CBO has been keeping account of the withering failure of monetary policy in a manner that economists don’t want anyone to explore. Rewriting economic “potential” within these very mathematical functions serves to undermine the core of orthodox economics itself, especially since the CBO is not just proving the lack of recovery but rewriting most of the 21st century economy with it.
It isn’t just the CBO, however, who has been pressed by regression into an impossible reconciliation. The Fed’s own models show almost exactly the same condition as the CBO with regard to shrinking “potential.” In the latest FOMC projections, released coincident to the June FOMC meeting, the models reduced the upper bound of the central tendency for long run real GDP to 2% from 2.1%; the lower bound of 1.8% remained the same.

In late 2011, the central tendency for long run growth was believed to be between 2.5% on the low side and as much as 2.8% at the upper bound. While that may not sound like much of a difference, it is huge. The long run growth rate takes into account full business cycles, meaning that the average growth must include both recessions and their recoveries. Peak to Peak (meaning the current quarter of GDP), total growth has been equivalent to just 1.2%, a stunningly (economists are literally stunned by this) bad run that now extends almost a decade.
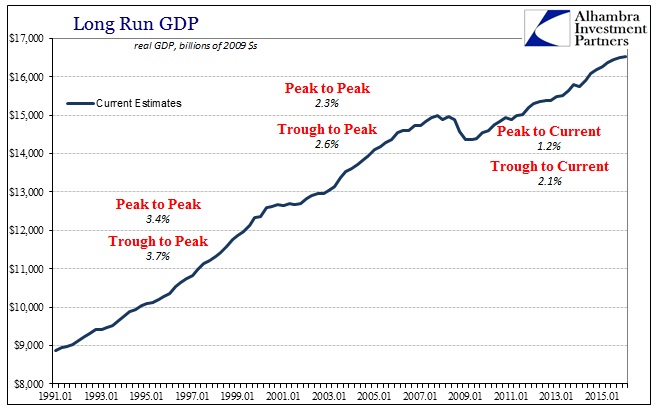
That is why the Fed has to mark down long run potential because not doing so would mean that at some point in the near future the economy is going to have to explode higher to bring up the average of this “cycle.” And the longer the economy persists in this mysterious “low growth trap” the greater that eventual “liftoff” will have to be get back to the normal long run tendency. Instead, economists have reduced economic potential because nobody believes any such thing will occur, note even them. Thus, they now have to come up with reasons that preserve their worldview while also accounting for the world – an increasingly impossible task. Even now the much-reduced long run tendency remains quite far out of reach, dampening enthusiasm all over again academically for both the timing and intensity of that anticipated “liftoff.”

In other words, the continued and “unexpected” lack of recovery after nine years of failure in monetary policy is forcing the math to recognize what is obvious in non-mathematical terms. No regressions are at all necessary to conclude that the bond market has, in fact, made sense this whole time and that it is economists who have no idea what is going on or why. By the mathematics of 2011, real GDP “should be” $19.3 trillion in Q2 2016; it was instead just $16.6 trillion after the third straight quarter near 1%.
To the academics, “gloom” is irrational and thus requires translation into math to become somehow backwards explanatory for why the economy that “should be” isn’t. In the actual economy, “gloom” is properly called reality. In this world, people know all-too-well that jobs disappeared during and after the Great Recession and never came back. No amount of asset price manipulation can possibly make up that difference. Economists try to convince everyone but really themselves that it didn’t matter when it is this very math that proves yet again it did; in fact, the true state of labor beyond the unemployment rate and Establishment Survey is all that matters.
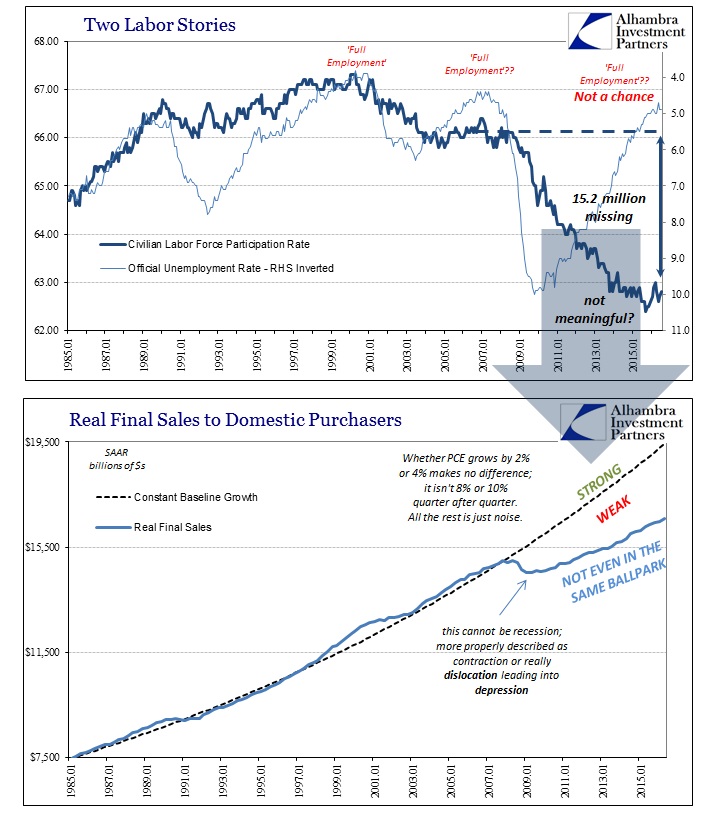
Further, the people recognize that this wasn’t just a cyclical process that started in late 2007; it was, in fact, an extension of the impoverishment that has been eroding the true economic foundation for more than just the 21st century where it has become most apparent.
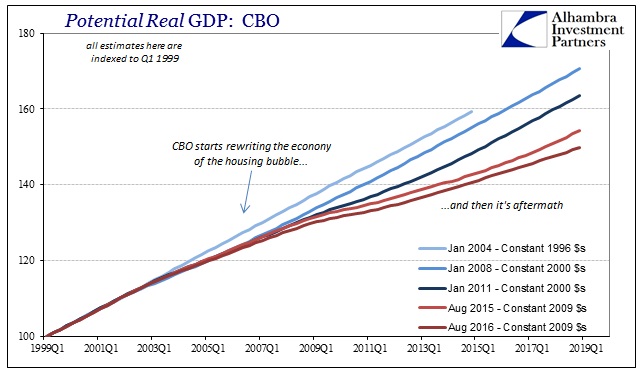
The math of potential and even gloom is just the frustratingly late catch-up forcing economists to come to terms with the fact they have been all wrong about all of this all along.
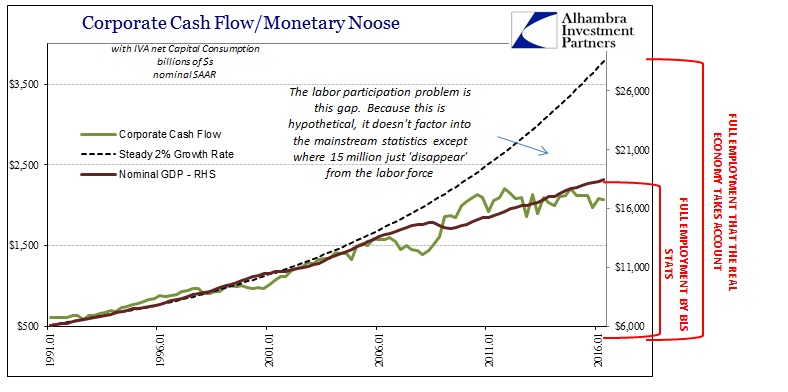
You need no PhD to so easily understand that you just cannot substitute jobs with debt; doing so is economic suicide.
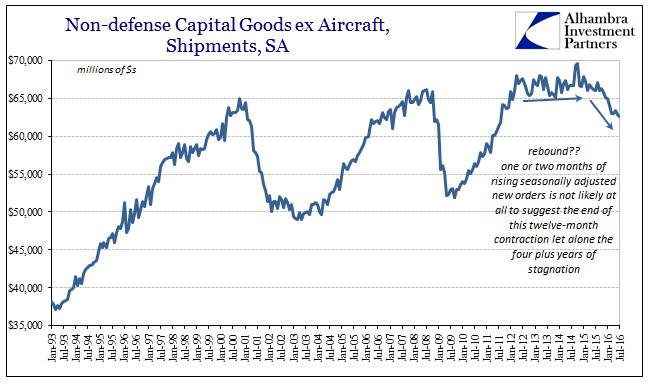
At some point over the long run you must come to terms with that discrepancy. This math is finally welcoming economists to that long run, a place their patron saint, Keynes, said didn’t exist. It really does as the math has been recalculated far more toward the “impossible”; even the “tight” money indicated by the bond market is recognition of these plain facts.
The post An Academic Tries To Explain The Yield Curve, Says “Gloom” Is Irrational appeared first on crude-oil.top.
