The commodity space has generally struggled today amid escalations in the US-China trade war. US President Trump announced a 10% levy on Chinese imports from September 24, rising to 25% next year. China has said it will decide today how to retaliate.
Base metals
COPPER fell as much as 2.3% this morning after US President Trump announced the next phase of tariffs on Chinese imports. The industrial metal edged down to 2.5605, approaching the August 15 low of 2.5393, which was the lowest since June 2017. Concerns about an escalation and prolongation of the US-China trade war and its possible impact on global growth are among the reasons for the pressure.
Precious metals
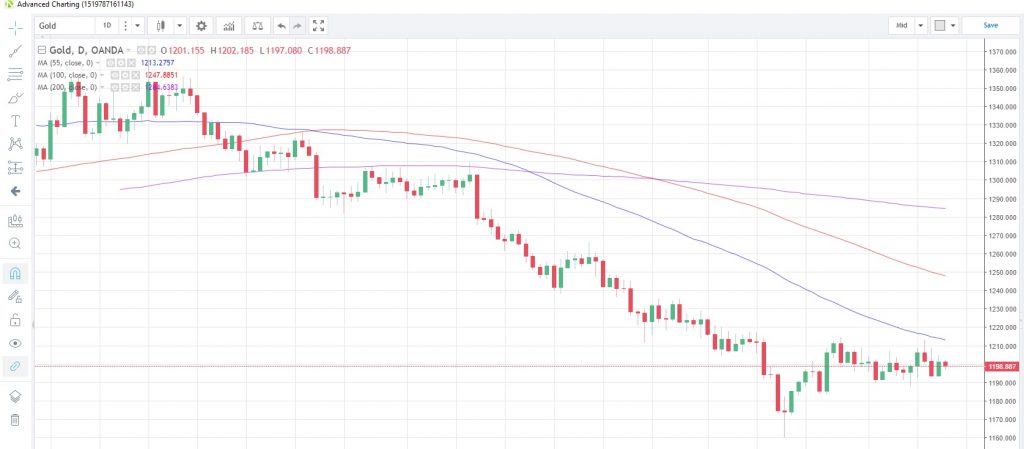
GOLD has potential to have its first up-week in four, despite the uptick in the US dollar after the fresh tariffs were announced. The metal is currently at 1,199.33, up 0.5% so far this week, and may be attempting a test of the 55-day moving average, which is currently at 1,213.28. That moving average has capped gold prices since April 25.
Gold Daily Chart
Speculative accounts reduced their net short exposure by 5,907 contracts in the week to September 11, according to the latest CFTC data. Bloomberg reports that gold holdings by Exchange Traded Funds shrank for the 17th straight week while those of the largest ETF fund, SPDR Gold Holdings, have fallen to their lowest since 2016.
SILVER is struggling to match the rebound gold has seen and is stuck close to the 30-month lows struck earlier this month. The gold/silver (Mint) ratio is holding near 10-year highs at 84.847, confirming silver’s struggles.
Speculative accounts reduced their net short positions in silver for the first week in six, according to CFTC data as at September 11. The nearest support point is probably the September 11 low of 13.9445 while resistance is possible at the August 28 high of 14.9993 and the 55-day moving average at 15.0598.
PLATINUM remains capped by the 55-day moving average, which has held on a closing basis since February 28. The metal is currently at 799.04 with the 55-day moving average at 811.63. Speculative net short positioning was reduced to 7,568 contracts, the smallest in nine weeks, according to CFTC data as at September 11.
PALLADIUM continues to benefit from the gradual shift from diesel-powered cars to gasoline-powered in the EU. Petrol-driven autos require catalytic converters, which use small amounts of palladium, and Bloomberg estimates that as much as 84% of 2018 consumption will be used in this area. This contrasts with the decline of platinum which is used more in diesel engines. The better outlook for palladium is reflected in speculative positioning, where accounts are net long and increased those longs to the highest in two months, according to latest data to September 11. The precious metal is now at 986.750, testing the 200-day moving average at 988.66.
Energy
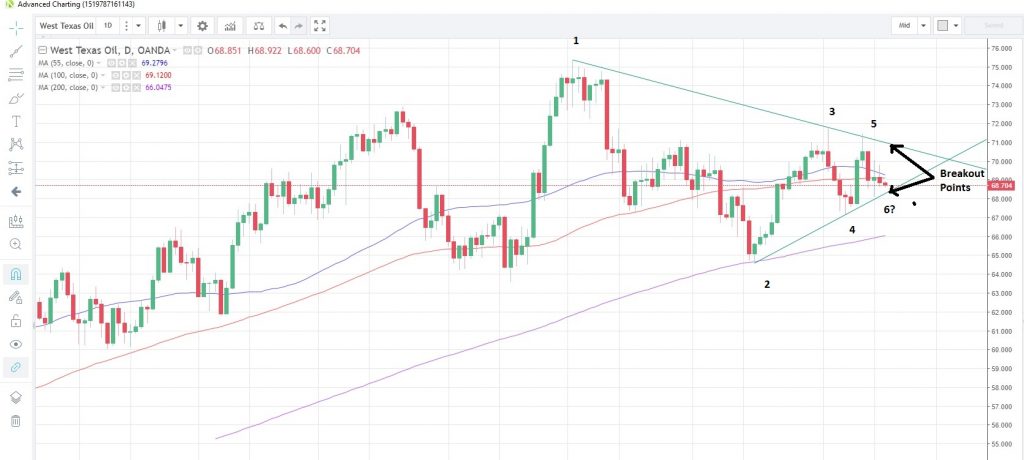
CRUDE OIL prices have been pressured by the clouded demand outlook when faced with the escalating tariff war, while the supply outlook also remains uncertain, with Iran sanctions due to kick in from November 4. WTI is slowly moving into the apex of a triangle pattern, which has been forming since the near-term peak on July 3. The breakout points today would be either $71.00 to the upside or $68.33 to the downside. WTI is currently trading at $68.724.
WTI Daily Chart
Brent crude peaked at $79.944 on September 12 and there is growing market chatter that OPEC members may be attempting to keep it neat $80 per barrel through to the US mid-term elections in November. The spread between Brent and WTI has narrowed to about 8.8 points from above 10 points last week.
NATURAL GAS is set for its second day of gains, though faces some tough technical resistance obstacles to overcome. Rising 0.3% today to 2.828, gas has three moving averages just above. The 200-day is at 2.8376, 55-day at 2.8455 and 100-day at 2.8590. The last time natural gas traded above all three moving averages was on September 12.
A German government spokesperson said yesterday that Germany’s gas market is open to all market participants. Currently Russia supplies 60% of German gas imports and there is speculation the US companies expect to start delivering liquefied natural gas to Germany within four years, even though it would cost more than Russian gas.
Agriculturals
The weather continues to play havoc with WHEAT supply chains as Australia contends with both droughts and cold snaps in various wheat-growing regions, with frost reported in the southern areas of Western Australia. Compensating somewhat for potential shortfalls in supply, Russia’s wheat exports are 48% higher this season than the previous one, according to data as at September 13 supplied by the Russian Agriculture Ministry. In contrast, the US revealed that its exports were down 10% y/y as at September 6.
Wheat continues to shy away from support at the 200-day moving average, which is at 4.7220 today, and has done since March 29. The commodity touched a two-month low of 4.739 on September 13 and has enjoyed a 3% bounce since then.
CORN took a tumble last week after the US Department of Agriculture boosted its forecasts for domestic production and stockpiles, even though farmers were planting less acreage as the yield per acre hit an all-time high. Corn had its biggest one-day fall since June 19 on September 12, the day the report was released. The commodity is now at 3.346 after touching 3.339 earlier today, the lowest since July 17.
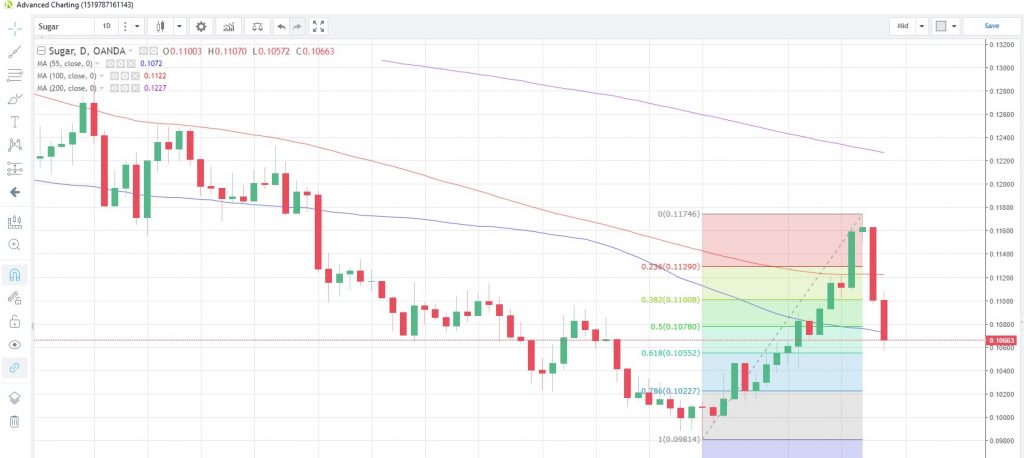
SUGAR has given back more than 50% of its August 22 to September 13 rally in the first two days of this week, and has broken back below the 55-day moving average at 0.1072. Sugar is currently trading at 0.10663.
The decline comes as news emerges that typhoon Mangkhut passed by most of China’s sugarcane growing area in the Guangdong province, and did not cause as much damage to the crop as initially feared. Guangdong province produces about one million tonnes of sugar each year, about 10% of the country’s output.
Sugar Daily Chart
SOYBEAN prices continue to be pressured by the US-China trade war with prices touching a two-month low this morning. Soybeans fell to 8.112, the lowest since July 16, and is facing its fourth down day in a row. The commodity is now at 8.155.
The drop comes even as news emerged of a potential supply disruption from China, where the top-growing region was hit by a frosty spell from September 9 to 10. This could cut output from the region by 4.5%, or 275,000 tons.


