The brisk turnaround in risk appetite last week, fueled by encouraging economic data and relatively strong Q1 earnings reports, has seen precious metals under pressure, while agricultural and energy commodities were mixed.
Precious metals
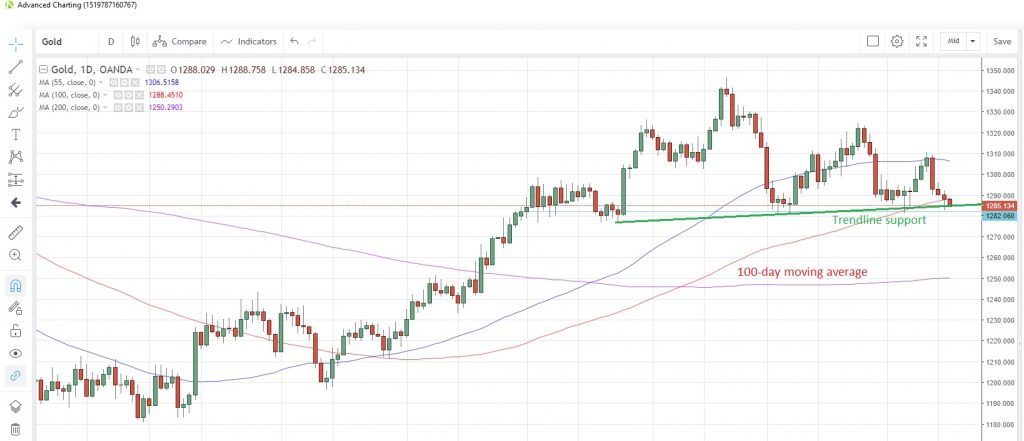
GOLD could be on track to close below the 100-day moving average at 1,288.47 today for the first time since November 15. The metal touched the lowest since April 4 yesterday and is testing trendline support around the 1,285 level.
Gold Daily Chart
Speculative accounts added to net long position in the week to April 9, the latest data from CFTC shows. Gold held by exchange-traded-funds is currently up 1.2% from a year earlier, according to Bloomberg calculations.
SILVER hit the lowest since December 26 yesterday, but rebound to close in the black and is currently pivoting around the 200-day moving average at 15.007. The gold/silver (Mint) ratio advanced for a third consecutive week last week, but looks poised to break that cycle this week. It’s now at 85.896.
Speculative investors reduced net long positions to the lowest since the week of December 11 in the week to April 9, the latest data snapshot from CFTC shows.
PLATINUM looks set to fall for a fourth straight session today, echoing the weakness in other precious metals. Platinum touched the highest since end-May early last week, but failed to maintain upward momentum and closed lower on the week. The metal could find some support as fears heighten that South African production could be disrupted as it faces a period of tough wage negotiations at its mines.
Speculative investors still remain bullish on the commodity however, increasing net long positions to the highest in more than 13 months.
PALLADIUM continues to drift sideways after the steep fall from above 1,600 late last month. The metal has opened below the 100-day moving average for the second day in a row and is hovering above 11-day lows. The inability to hold the key 1,600 level has seen more speculative bulls bale out of speculative long positions, with investors reducing net longs for a seventh straight week to April 9. Net long positioning is now at its lowest since the week of September 18, according to the latest CFTC data.
Base metals
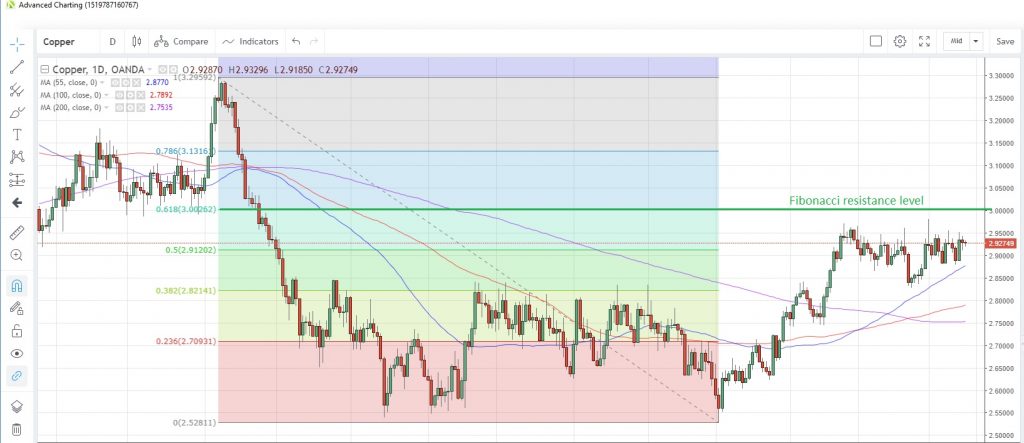
Reports of progress in the US-China trade negotiations continues to support COPPER prices, though without a confirmed deal the industrial metal appears to lack the power to break above the psychological 3.00 level. Prices have traded below this mark since June 25. The level is also close to the 61.8% Fibonacci retracement level of the June-January drop at 3.0026. A stronger-than-expected China Q1 growth number, which is due for release tomorrow, could be the catalyst to propel prices through this key level.
China’s imports of copper concentrate hit record levels in Q1. Imports hit 5.6 million tons amid an increase in domestic smelting capacity.
Copper Daily Chart
Energy
CRUDE OIL remains supported by supply concerns, particularly surrounding Libya, but seems to be lacking upward momentum and could be facing the first down-week in seven weeks this week. West Texas Intermediate has failed to maintain a foothold above a key Fibonacci level at 63.894 (61.8% retracement of the October-December decline) and is now at 63.257.
Data released Friday showed an increase in US oil rig drilling activity for a second straight week, which could help bridge the shortfall from OPEC cuts. Meanwhile in a report released Friday, IEA’s executive director said that oil prices above $70 per barrel (Brent crude) is acting as a drag on global demand. In the report, the IEA maintained its forecast for global demand for this year at 1.4 million barrels per day, but it could face a downward revision if oil prices remain high. Brent crude is trading at 71.280.
Speculative investors remain bullish on oil though, adding to net long positions for an eighth straight week in the week to April 9, CFTC data shows. Net long futures positions are now at the highest since the week of October 9.
NATURAL GAS failed to gain any upward traction amid colder weather, so now that a warmer spell is forecast for the US east coast, the downside would appear to be more vulnerable. Gas prices are at two-month lows and risk breaking through the February low at 2.57, which in turn was the lowest since December 2017.
The lack of upward momentum was an encouragement to Natural Gas bears, who added to net short positions for the first time in three weeks to April 9, CFTC data shows, and they are now at the highest in more than a month.
Agriculturals
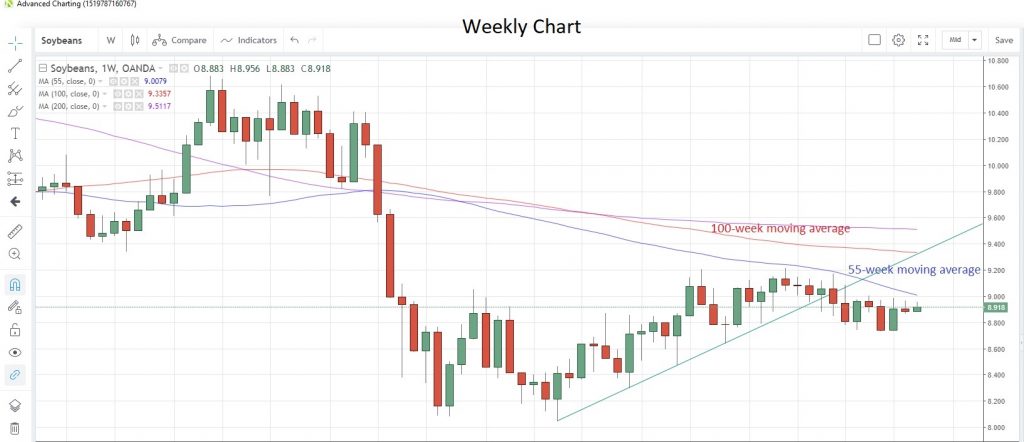
SOYBEAN prices are showing signs of rebounding from last week’s losses but still need to rise above the 55-week moving average at 9.0079. This moving average has capped prices since June, and a sustained break above would bring the 100-week moving average at 9.3357 into focus.
Soybeans Weekly Chart
Hopes for progress in the US-China trade talks, and hence an increase in Chinese purchases, are helping to support prices, though without a confirmed deal the traction could be fleeting. The latest development in the talks is that both sides are expected to establish “enforcement offices” to ensure compliance, according to US trade secretary Mnuchin.
The rebound from this year’s low over the past few weeks has seen speculative investors scaling back their net short positions. Investors trimmed shorts for the third week in four in the week to April 9.
CORN could face some supply issues as heavy rains are forecast across the US South and Midwest, which could delay seed planting and impact harvests. Prices touched near two-week highs yesterday and are still attempting to recover the heavy losses suffered on the last trading day of March. The 200-day moving average at 3.5909 appears to be the first hurdle that needs to be overcome. Despite the rebound, speculative investors are most bearish on corn since October 2013.
WHEAT prices have been range-bound over the past week even amid reports that storms hitting the Central US area could potentially damage crops and delaying fresh planting. Speculative investors are turning less bearish, reducing net short positions for a fifth straight week, to the lowest since the week of February 29. That’s according to the latest CFTC data as at April 9.
It has been another tight-ranged week for SUGAR prices, which haven’t been able to break out of the 0.1232-0.1292 parameters that have contained activity for the past month. There haven’t been many updates on crops outlooks or harvesting totals apart from out of Brazil, where favourable weather is creating a more positive outlook for harvests. Sugar bears are losing patience and scaled back net short positions for a fourth straight week to the lowest since February 26.


