Overall, the first salvos in the US-China trade war has undermined confidence in the metals space, with traditional safe-haven assets struggling for traction as other havens offer better returns. The energy sector has been driven higher by supply concerns, while the agricultural sector remains broadly under pressure.
Precious metals
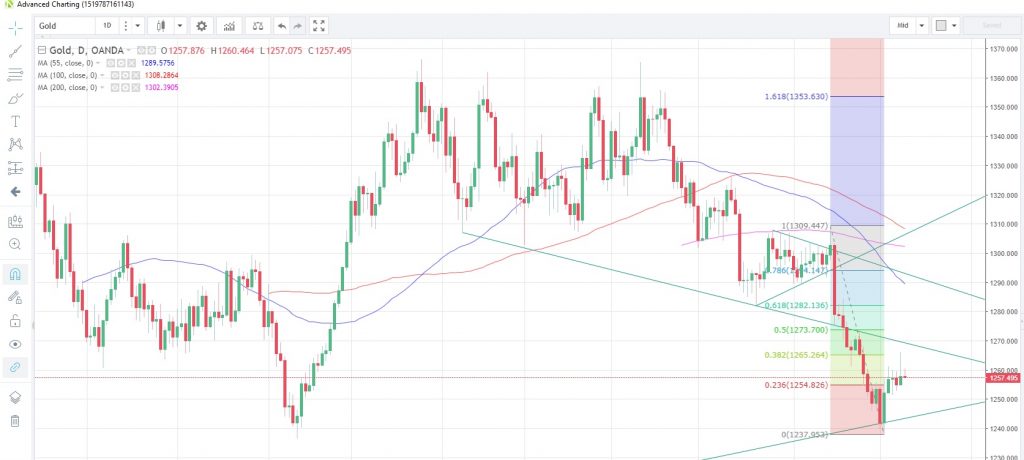
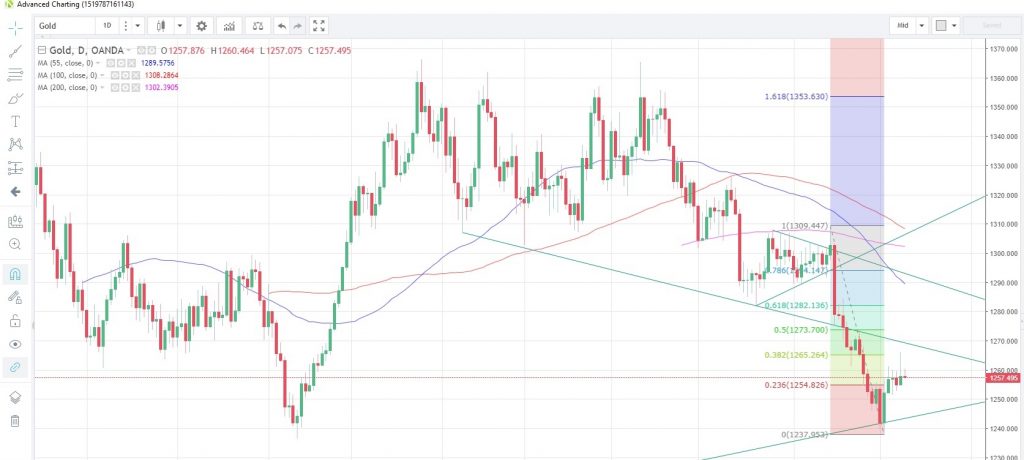
Gold had been at the mercy of the US dollar’s firmness during the second half of June, struggling to maintain its label as a safe haven in times of trouble. The precious metal slumped almost 5.5% vs the dollar from its recent peak on June 13 to the near-term low on July 3. The rebound so far has taken the metal to the 38.2% Fibonacci level of the drop and is now consolidating at 1,257.513.
Gold Daily Chart
Latest data from Chicago’s Commitment of Traders report, with the snapshot taken as of July 3, shows that managed money accounts were net sellers of 1,230 gold contracts from a week prior and short positions exceeding long positions by 1,254 contracts.
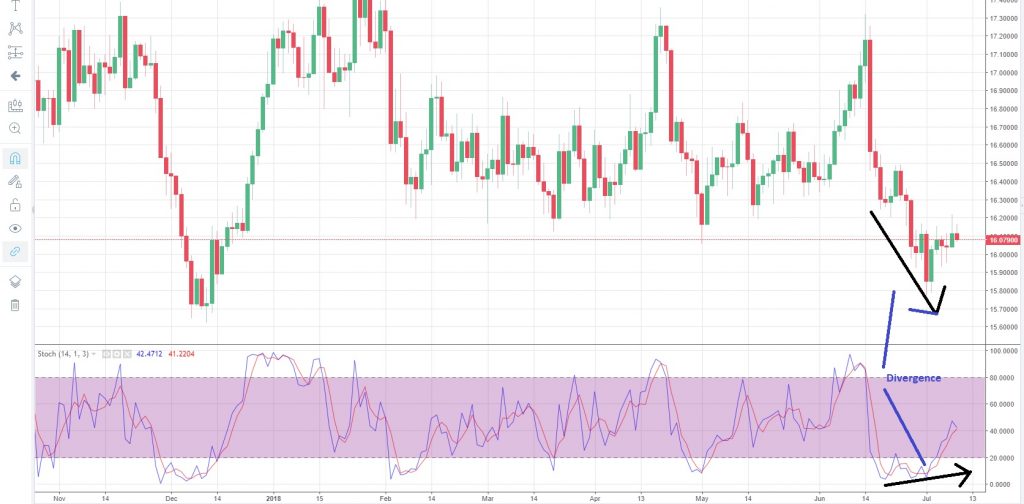
Silver has also tracked hold’s progress to some degree during the period. The sell-off in the second half of June saw a bullish divergence pattern unfolding on the stochastics momentum indicator, which suggested a near-term base could be forming. Sure enough, we have seen the rebound unfolding this month and the next resistance point can be found at the 55-DMA, currently at 16.4320.
Silver Daily Chart
The gold/silver (Mint) ratio seems to have built a near-term base mid-June and has since rallied to test the 55-DMA at 78.4841. It is also oscillating around the 200-DMA at the moment during its consolidation period.
Platinum is staging a modest recovery from its near-5 month downtrend after the metal traded below the 800 mark at the start of the month, the first time since December 2008. The 55-DMA continues to cap to the upside while the July 3 low of 798.365 should hold in the near-term.
Palladium is trading near the middle of its recent 3-month range. It is currently retracing the uptrend started at the beginning of 2016 and has so far managed a correction as deep as 21%. Palladium is currently trading at 954.853.
Base metals
Copper has fallen just over 6% so far this month to touch its lowest level since July last year. The base metal is testing the 100-week moving average, which has held on a closing basis since November 2016. However, investors are keeping an eye on labour negotiations at BHP Billiton’s Escondida mine in Chile, the largest in the world. The current contract expires at the end of this month and any signs that negotiations become protracted and an agreement may not be reached could have implications for copper supply and result in higher prices.
Energy
Natural Gas continues to struggle to gain traction after the hefty slump in February this year. As we are in the midst of the summer months in the northern hemisphere, pressure should remain on gas with near-term support found at the 100-DMA at 2.7914.
Latest data from the US Energy Information Administration (EIA) storage change released last Friday showed an increase of 78 billion cubic feet, higher than the estimate of 75 billion and up from the previous week’s 66 billion. Stocks were 717 billion cubic feet less than this time last year.
Crude oil prices have been edging higher since the OPEC meeting last month amid supply concerns and steady demand. Brent prices received an additional boost following news today that oil workers in Norway are scheduling a strike later today after recent wage talks failed. Coupled with supply issues from Libya after oil port closures, Iran heading toward US sanctions, and ongoing issues with Venezuela, the path oil least resistance for oil prices still appears to be higher. West Texas prices scaled $75 p/barrel last week, while the 100-month moving average is at 74.6907. West Texas CFD is now trading at 74.094 and the Brent/WTI spread is about 4.3 pips.
Brent/WTI Spread Chart
Agriculturals
Sugar continues to feel the pressure of rising global stockpiles amid surging production in Asia, and slowing demand. Money managers added more than 30,000 contracts to short positions, according to the latest CFTC data as of July 3. As with any crop, the weather could play a significant role and the second half of the year could see concerns about another El Nino weather pattern in Asia emerging. That could be the only hope for bulls. Sugar is now at 0.11165
Corn is attempting to recoup some of June’s heavy losses, and having a tough time of it. This despite a June 29 report from the US Department of Agriculture that showed total acreage for corn and soybeans down 1% from a year ago.
With Soybeans a target for China import tariffs in retaliation for the Trump administration’s actions, soybeans are struggling to bounce strongly off recent 9-1/2 year lows. Friday’s low of 8.334 should provide near-term support while the June 25 high of 8.961 will be the next resistance point.
Wheat broke a three-day rising streak on Monday and has continued the retracement today. Daily momentum has turned bearish, suggesting the fall has a bit further to g
Trade war -will cooler heads prevail ?


