The dollar’s resurgence on safe haven buying after more Trump rhetoric on tariffs and firmer US yields on the back of a strong US jobs report is taking its toll on most precious metals. Copper and oil are struggling from an uncertain demand outlook while the agricultural sector is caught up with supply issues.
Precious metals
Net short GOLD positions held by speculative accounts are at their highest since December 2001, according to the latest data published by CFTC as at September 4. During that week, net short positions increased by 10,434 contracts from a combination of a reduction in outright longs and an increase in outright shorts.
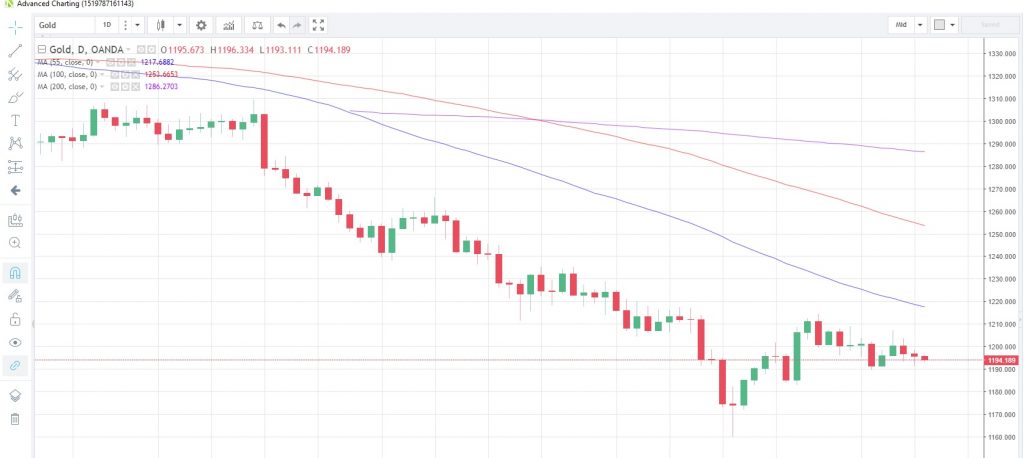
Gold has been confined to a 1,190.15 – 1,207.10 range over the last week and is set for its third daily loss today as the US dollar’s bid tone is reignited on concerns of a further escalation in the US-China tariff war. Immediate support may be found at the August 24 low of 1,183.15 accompanied by the 18-month low of 1,160.21. The 55-day moving average continues to cap the upside
Daily Gold Chart
SILVER also continues to be at the mercy of the rising dollar, though has managed to hold above the psychological 14.00 level for the past week. Indeed, silver has traded above the 14.00 level since January 2016. Speculative net short positioning is at its highest since data started being recorded in 1993, latest CFTC data shows.
The gold/silver (Mint) ratio is trading near its highest levels since October 2008. The ratio hit 85.206 last Friday and is currently at 84.398.
Net speculative short positions in PLATINUM are at their highest since data began in 1993. Accounts are net short 11,916 contracts as at September 4, that’s an increase of 940 contracts on the week. Prices have been relatively stable over the past week, consolidating above the near 10-year low struck mid-August. The commodity is currently trading at 786.799.
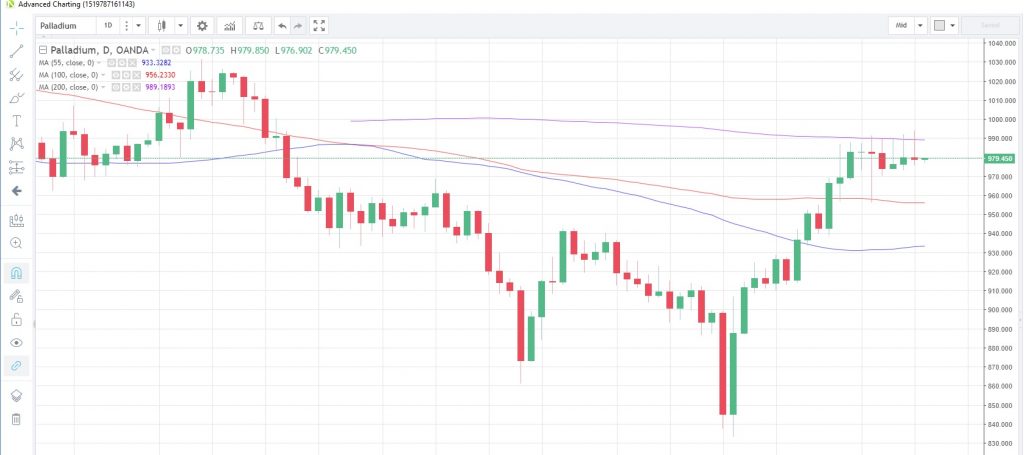
PALLADIUM has been testing resistance at the 200-day moving average of 989.182 for the past week and, so far, has been unable to breach it convincingly. In contrasts to the other precious metals, speculative net positioning is long, and traders added to long positions for the second straight week to September 4, latest CFTC data shows.
Palladium Daily Chart
Base metals
COPPER prices remain depressed amid demand concerns as the US-China tariff war appears to be escalating. Trump’s Friday comment that he would be willing to slap tariffs on almost all Chinese imports, threatening duties on $267 billion of goods over and above planned tariffs on $200 billion of Chinese products, has ensured copper will struggle to rebound from the near 15-month lows amid global growth concerns. Estimates suggest that an expansion to cover almost all Chinese imports would knock 1% off Chinese copper demand since a number of copper-intensive goods would be included in the extended list, Reuters reports.
Energy
The hurricane-induced rally in CRUDE OIL is being dialed back after the tropical storm came to naught. Only today is WTI poised to snap a five-day losing streak from the near-term peak at 71.782, with gains of just 0.08%.
American producers are reportedly seeking buyers for crude supplies which would normally have been headed to China. This has caused the WTI/Brent spread to widen out to almost $10 per barrel, the widest since June.
NATURAL GAS inventories are expected to be scaled back when the latest EIA data is released on Thursday. Estimates forecast a reduction to 50 billion cubic meters from 63 billion the previous week. Moderating weather could reduce the fuel’s demand in the near-term but the broader shift toward cleaner burning fuels should keep prices supported in the longer term. Gas is currently trading at 2.820 having rallied 2.2% from yesterday’s low of 2.759, which in turn was the lowest in six weeks.
Agriculturals
US SOYBEAN growers are poised to harvest their largest ever crop even as stockpiles of the commodity are surging. Recent estimates suggest stocks are 40% above the previous record set a decade ago, according to Bloomberg. Markets will be on the alert for the USDA’s WASDE (World Agricultural Supply and Demand Estimates) report scheduled for release tomorrow, September 12.
Soybean Stockpiles
China customs data released at the weekend showed soybean imports rising 14% in August from a month earlier. There was a noticeable shift to imports from Brazil after Beijing imposed tariffs on US imports. China’s attempt to turn to domestically-grown soybeans when faced with import tariffs was dealt a blow earlier this week after cold weather reports in the northeast part of the country raised concerns about damage to crops.
Soybeans are on a gradual uptrend, aiming towards the 55-day moving average at 8.5498 with daily stochastics momentum indicator giving a bullish reading.
WHEAT continues to hold above the 78.6% Fibonacci retracement level of the July 11 to August 2 rally at 4.839. On September 7, the commodity touched a near-eight week low of 4.841 and has seen a healthy rebound since then to 5.067. The 55-day moving average is at 5.087.
The strong up-move could be attributed to news that Australia has cut its wheat production forecast for the 2018/19 season by 13% to a 10-year low, due to severe droughts across many growing regions.
SUGAR is continuing its rebound from the August low and is now testing resistance at the 100-day moving average at 0.1123. The commodity has so far managed a 13.6% rally from the 10-year low of 0.0981 hit on August 22. Mauritius, where sugar is its biggest agricultural export, has trimmed its 2018 output estimate by 5.7% due to unfavorable weather and lower tonnage from small producers.
CORN is poised for its fourth up-day in a row, though gains are mediocre at best. The commodity is currently trading at 3.527 with the upside likely capped by the 200-day moving average at 3.6080 and the 100-day moving average at 3.6380. The August 29 low of 3.383 is a possible support point.


