The US dollar is facing a mild period of weakness ahead of a slew of central bank rate decisions and key data this week. Despite the dollar’s retracement, commodities have mostly failed to capitalize. Precious metals are still pressured by a gloomy demand outlook and news that growth in China’s manufacturing sector had slowed for a second month has added to the pressure. Oil has rebounded amid supply concerns, while crops are mostly suffering from lingering excess inventories and supply.
Energy
CRUDE OIL has pushed up to more than two week highs as supply issues hold the market’s attention. Reports that some North Sea fields are shutting down due to labor strikes, ongoing Middle East geopolitical tensions threatening to disrupt Saudi Arabia supply lines, continued difficulties with Venezuela’s output and the looming imposing of Iran sanctions are all contributing to the bid tone, which has seen WTI rise from $67.5 to $71.09 yesterday.
According to a recent Reuters survey, production from OPEC members hit a 2018 peak in July, one month after the new OPEC accord was struck in Vienna. Following the OPEC decision, Kuwait and the United Arab Emirates raised output by 80,000 bpd and 40,000 bpd respectively in July, the survey found with all members pumping a total of 32.64 million barrels per day, up 70,000 bpd from June.
European Commission’s Jean-Claude Juncker met with US President Donald Trump last week for talks aimed at avoiding a trade war. One of the outcomes of the meeting was that the EU agreed to buy more US NATURAL GAS to diversify its energy supply. Natural Gas looks set for its sixth straight day of gains as it climbs from two-month lows hit earlier this month. The first technical resistance point comes at 2.8424, which is the 200-day moving average, with the 55-day moving average close behind at 2.8594.
Precious metals
GOLD continues to be top heavy near the lower end of this month’s range. Even with the US dollar giving back some of the recent gains ahead of the FOMC meeting on Wednesday (NYT), gold has struggled to make any headway. Latest data from CFTC shows speculative accounts reduced their net long positions in gold by 9,200 contracts in a snapshot taken July 24. Gold is currently trading at 1,221.8 with support expected at the recent low of 1,211.1 and resistance at the 55-day moving average at 1,266.2.
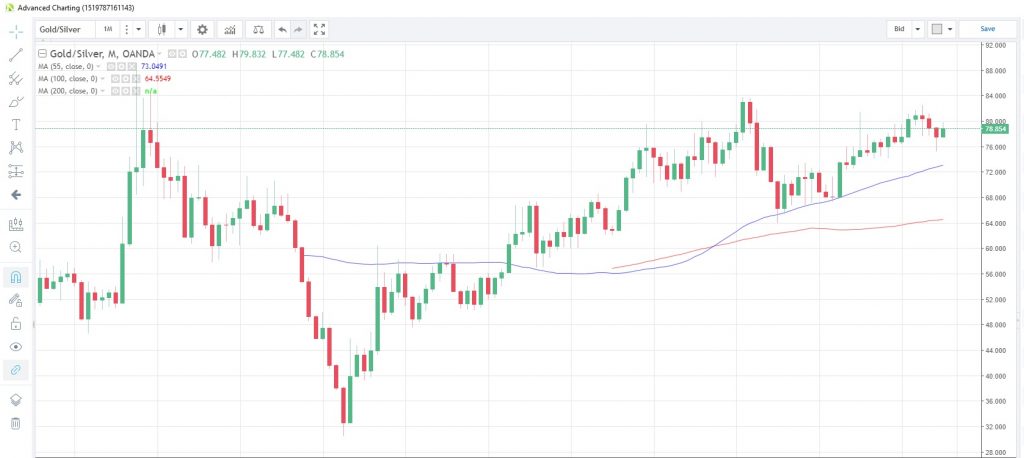
SILVER likewise is unable to shake off the summertime blues and is also trading at the lower end of the month’s range, facing its second monthly decline in a row. The gold/silver ratio is still holding above the 55-month moving average, currently at 73.05, and has traded above it on a closing basis since March 2013.
Gold/Silver Monthly Chart
Slowing industrial demand for PLATINUM continues to weigh on prices as the automotive industry continues its shift away from diesel engines. The precious metal has been on a steady decline this year, dropping almost 23% from its peak in January and the fundamental outlook suggests more declines to come. Speculative accounts are still maintaining net short futures positions, according to the latest Commitment of Traders report as at July 24.
PALLADIUM attempted a technical rebound early last week but this stalled on Thursday and is now in consolidation mode below the 55- and 100-day moving averages at 962.53 and 968.11, respectively. Speculative accounts were net sellers of futures contracts in the week up to July 24, according to the latest CFTC data.
Base metals
COPPER continues in the doldrums with prices struggling to extend the slight rebound from one-year lows near 2.65. Reuters reported Monday that Brazil’s geological service is considering auctioning off rights to six previously unexplored areas next year. It is reported that these areas could be significant sources of copper, gold and minerals.
Agriculturals
A bumper SUGAR harvest in Mexico was completed early-July with a 39,000 metric ton increase from previous estimates, according to the latest USDA sugar and sweeteners outlook. Most of this will be destined for international sugar markets and this has helped keep sugar prices under pressure this month. Sugar prices today hit 0.10616, the lowest level since September 2015. Momentum indicators on the charts suggest further downside is possible, and the next support level can be found at the August 2015 low of 0.10018.
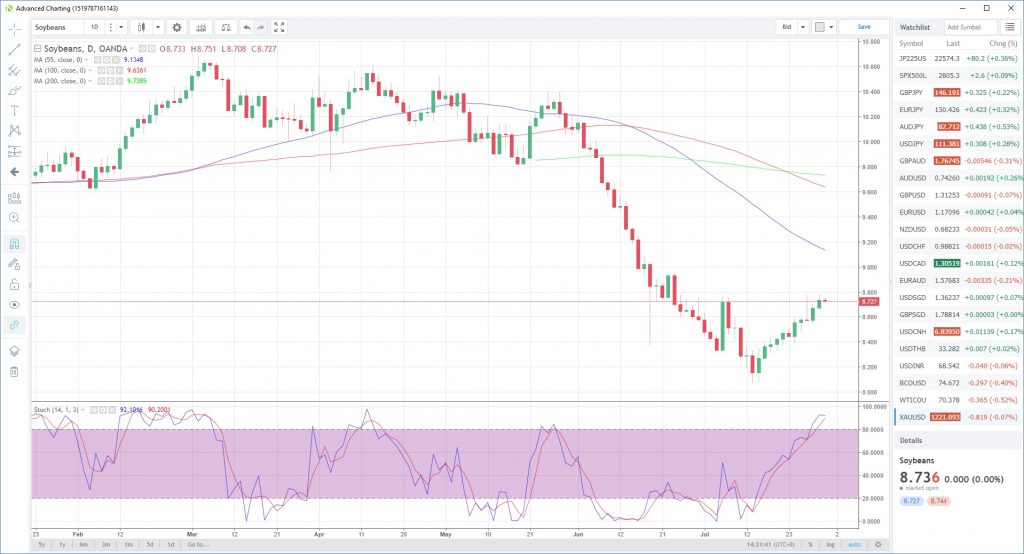
SOYBEANS saw heavy demand in June as exporters rushed to deliver orders ahead of the introduction of import tariffs by China as part of the first tranche of tariffs in the US and China trade war. Even so, prices collapsed in the month amid the combined pressures of favorable US growing conditions, increased sown acreage and inventory overhang. July has seen prices rebound from mid-month lows to stand at 8.733 currently. On the daily chart, stochastics momentum is starting to look stretched and the soybean CFD seems to be struggling to breach the 8.757-8.783 area, which has capped gains on six separate occasions since late June.
Soybeans Daily Chart
In its July WHEAT outlook, the US Department of Agriculture reported that vastly improved weather conditions from a year ago have helped lift projected yields for spring wheat in the 2018/19 season. Expanding US production and a reduction in production from overseas competitors suggest the 2018/19 crop could see higher exports, the report says. Despite the increased supply, wheat is retesting the June high of 5.421 and, if breached, would take wheat to a more than one-year high. The commodity is currently trading at 5.328 after touching 5.405.
CORN is continuing its strong rebound from 22-month lows having risen in eleven out of the last twelve trading sessions. The crop is currently at 3.603, testing the 55-day moving average at 3.6159 for the first time since June 4.


