For quite a while, I was getting solicitations from a site (which I won’t bother naming, for reasons that shall soon be clear) that promised to “revolutionize” investing by showing actual results of portfolio picks to the investing public. This kind of web site has been done a dozen different ways over the years, so it was hardly unique, and my skin crawls any time any tech company promises to “revolutionize” anything, even if they find a comely lass (that can’t stop smiling) with an off-the-shoulder dress to promote its virtues.
I had pretty much forgotten about the site, but for no particular reason it occurred to me to check in on them and see how they were doing. The site was up and running, and on the home page was a list of their superstar stock pickers and their returns. I was sort of blown away to see the result at the very top:
Now, I’m a simple soul, and I’m no math wizard, but when I see something like this, what it tells me is that, over the course of 63 stock trades, this chap’s stock picks have thrown off a 221% return, and each of the 63 trades lasted, on average, 6 days. In other words, if I started with an account of $100,000, I’d now have an account of $321,000, less a little bit for commissions. So that’s pretty much a “wow”, considering the trades lasted just six days on average.
Clicking on the link for Dr. (!) Carr, I saw more detail:
Nearly 500% In three months? Good lord! Tell me more!
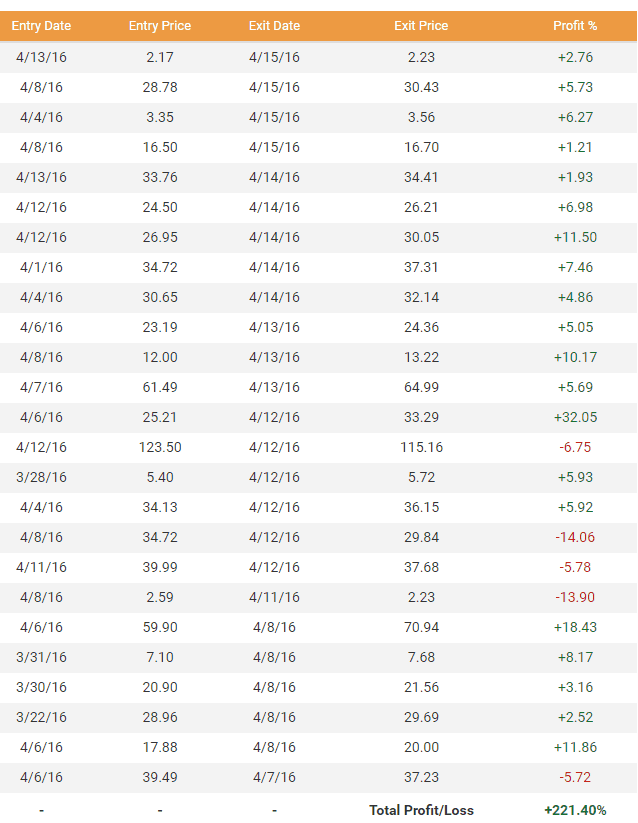
So I clicked on the detail, and then I started to get the picture……..
So after a moment’s thought, it occurred to me…………are these guys just adding the numbers together?!?!?
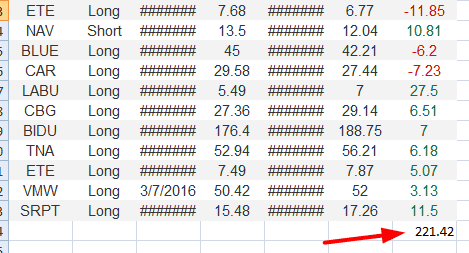
I went through all three pages of trades, pasted them into Excel, did a SUM function, and:
So, look, let me be clear: as I said earlier, I am not a math wizard. Not even close. I can handle basic arithmetic, however, and I can tell you that when you are looking at stock trades, you AVERAGE out the results. You don’t add up the stinking things!
Putting this another way, if you tell me that you placed 100 trades in your portfolio, and you made 1% on each of them, well, that’s just lovely, but your return is not 100%. It’s 1% (less commissions and such, which makes it probably closer to nothing percent). By the same token, if you make three trades in a row, and you lost 50% on the first and make 25% on the next two, your portfolio won’t be unchanged, as the sum would suggest. It will, in fact, be down about 22%, because the two 25% gainers didn’t make up for the 50% loss in the first place. But that’s a matter of sequencing, which goes beyond this little rant.
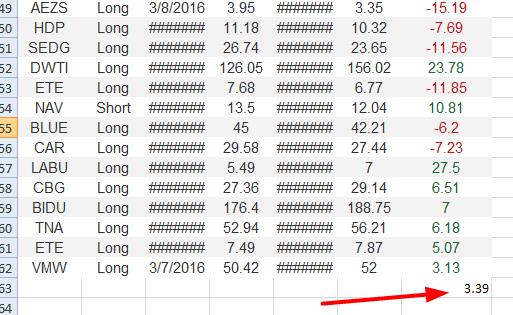
The simple fact of the matter is that all the trades listed didn’t throw off a profit of 221%. Indeed, when using AVERAGE, the result is just a skosh different:
In other words, 3.39% (assuming, again, no commissions and no slippage of any kind, which simply isn’t realistic either). Indeed, the real figure is going to depend on a series of complex variables such as how much of the portfolio was committed to each trade, and the precise sequencing of the opens and closes.
So, look, for this many trades with such a short holding period, it isn’t a terrible return at all (although the plain old SPY has gone up about 2.1% over the same month, so it’s not that big a deal, actually). I at least wanted to point out that a (hopefully innocent) mathematical foible throws off a figure which is wildly and crazily different than reality. It isn’t 221%. It’s much closer to a figure with the decimals placed two places left of that.
The post Great Moments in Portfolio Mathematics appeared first on crude-oil.top.


