Authored by Sven Henrich via NorthmanTrader.com,
In early March I mused about a market paradox, one where tech would make new highs on a negative divergence while the $DJIA would not make a new high. This event did indeed transpire and it still may have significant implications as it is so very reminiscent of the action we saw in the year 2000. Same time frame too. Since the correction phase commenced in February we have seen plenty of volatility and solid 2 way action as one would expect during a correction. Yet key to watch during these movements is the emergence of patterns and assess their relevance as they may be indicative of the next big move.
Curiously, as volatile as the action has been $NDX, as an index, does not appear to show much of a correction at all in context of its longer term quarterly trend, hence I asked yesterday:
$NDX quarterly chart: What correction? pic.twitter.com/UG9Xt0SWAR
— Sven Henrich (@NorthmanTrader) April 19, 2018
If Q1 represents a larger correction then please tell me where there is evidence that the most valued and overbought sector, tech, has actually corrected.
We haven’t even tagged the quarterly 5 EMA on $NDX and it’s up 6 quarters in a row. All we’ve had is another higher low and an intra-quarter dip. That suggests a pullback in context of an overbought spike, but no correction. A correction should leave some evidence that there actually has been one. No, from my perch this means that tech has yet to properly correct.
Given the high on a negative divergence and $DJIA failing to make a new high can we draw any conclusions yet as to the next larger move?
Frankly, not quite yet, but charts are suggesting that next week may be very pivotal for tech in particular. A do or die moment.
Zooming in on the weekly chart of $NDX we can observe this pattern:
It has a very distinct heads and shoulders pattern feel to it, but it’s an unconfirmed pattern.
I mentioned 2000 at the beginning of this post and this is what the structure looked like back then and note the right shoulder build on April:
Freaky no?
..which then was sold into May:
So why is next week then so important? Because some of the larger tech companies have yet to report earnings. As their market caps are so tremendously impactful the reaction to their reports will likely determine whether we will see this pattern repeat or whether it will become invalidated.
Hence a quick high level technical look at some of the key tech stocks:
$FB: Broken trend line, below the weekly 50MA:
Can it recover? Sure, but its PR woes are not going to disappear anytime soon. Be curious to see how how many people deleted their accounts. I finally had enough myself and deleted mine, the data mining being secondary to the fact that I just saw no real utility for my life. But my view is irrelevant. Fact is this stock has yet to enter a major correction, but we have a trend line break and it’s a warning sign.
$MSFT: Q1 saw 2 trend lines tags and the stock is back to near all time highs. The stock has more than doubled since 2016 and I see no technical damage at this stage. It could well go on to make new highs. Its earnings report reaction will be key:
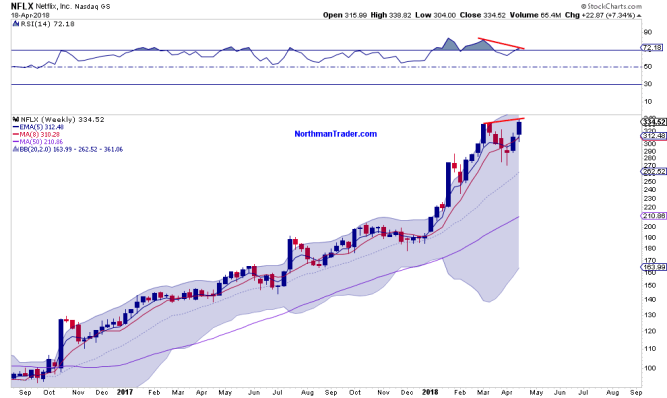
$NFLX has reported and made a new high on a negative weekly divergence. The stock is up 75% in 2018. 
$AMZN remains above all trend lines, but like $NDX, could be setting up for an H&S pattern and right shoulder build here:
$GOOGL also held its trend line and has bounced off of its positive divergence. It could go higher still, yet if the trend line breaks it’s lights out and we can target the lower open gap. Lower highs so far.
$AAPL: What correction?
So these big boys have yet to see a sizable correction of any sort as far as I’m concerned and next week may well be a do or die moment for tech.
The post It’s Do-Or-Die For Tech Stocks appeared first on crude-oil.news.


