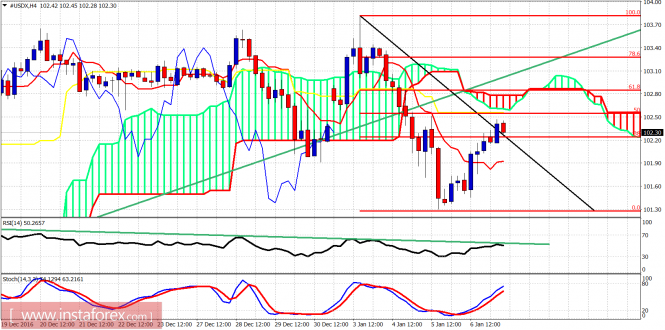
The Dollar index is bouncing as part of a retracement process of the decline from its latest high. I believe the downside is not over for the Dollar index. This bounce looks more like a backtest of the broken support rather than the start of a new upward move.

The Dollar index is testing short-term Ichimoku cloud resistance at 102.40-102.50. This is also the 50% Fibonacci retracement of the decline. However the most important resistance level bulls need to break is the 61.8% Fibonacci level at 102.90. Price is below the Ichimoku cloud and this favors bears.

Green line – long-term support
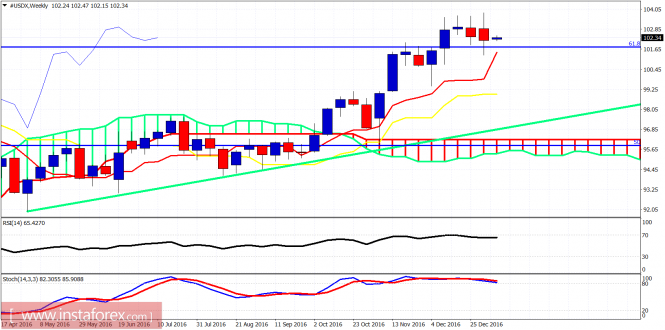
On a weekly basis, the Dollar is overbought, diverging and showing bearish reversal signs. The first sign came last week with the break below 102. We are now backtesting this breakdown. If the week closes below 102.15 we will have another bearish sign. However, the strongest bearish sign will come on a break below 101.25. Then price will be heading straight to 99. On the other hand bulls need to break above 102.90 first and next 103.70.
The material has been provided by InstaForex Company – www.instaforex.com
The post Technical analysis of USDX for January 9, 2017 appeared first on forex-analytics.press.