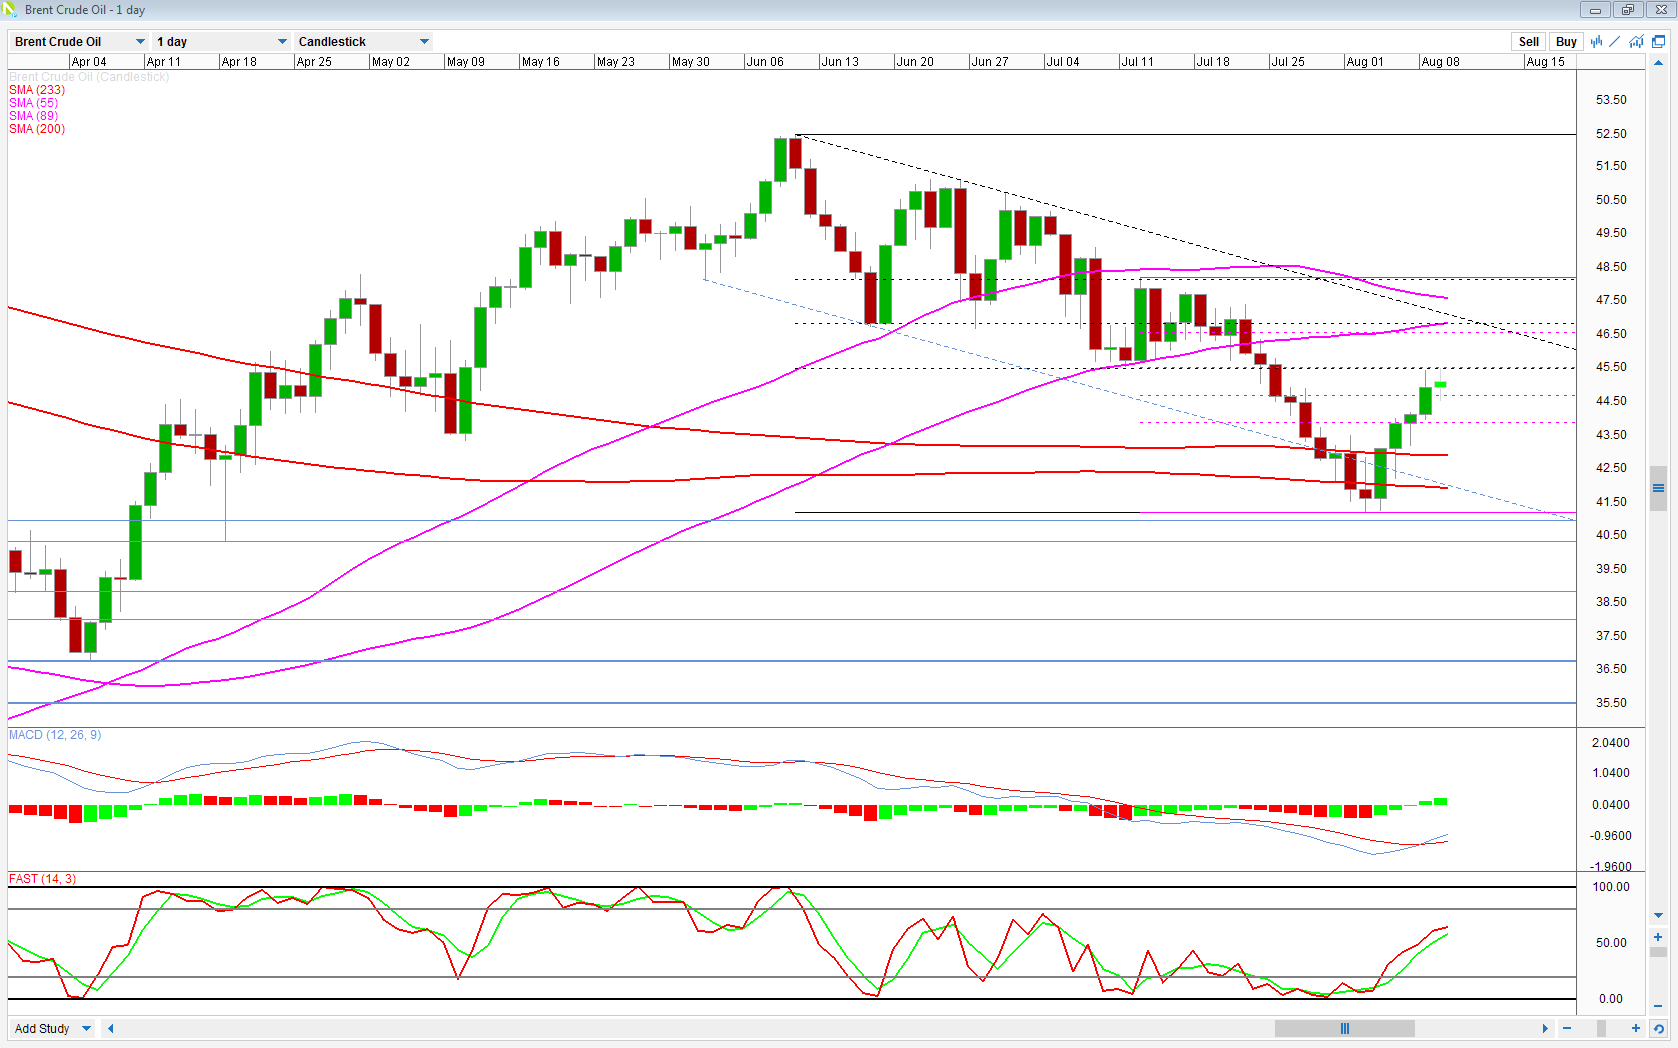
A week ago today, Brent crude touched its lowest level since 18 April and was back in bear market territory having fallen more than 20% from its highs a little under two months earlier.
Since then, we’ve seen a correction in oil, helped along by reports that OPEC are planning to meet on the side-lines of the International Energy Forum in Algeria next month, with recent price developments and output high on the agenda.
OANDA MP – Sterling Under Pressure Again (Video)
It’s too early to speculate on the outcome of this meeting but given how these meetings have recently gone, expectations of a production freeze or cut being agreed are understandably low. That said, the mere fact that this is happening increases the possibility of joint action at a time when US oil rigs are on the rise again after falling more than 75% since October 2014.
The question now is whether we’ve seen the full correction in oil or is there more upside to come.
Brent has run into strong resistance around $45.50 over the last 24 hours, a level that was a key level of support for a couple of weeks in the middle of July (from 7th to the morning of 22nd) and is also the 61.8% retracement of the move from 12 July high to last week’s low.
This was sold into at the first time of asking and the same looks to have happened on the second attempt as well, despite managing a marginally higher high in the process, albeit on considerably lower momentum (MACD histogram and stochastic).
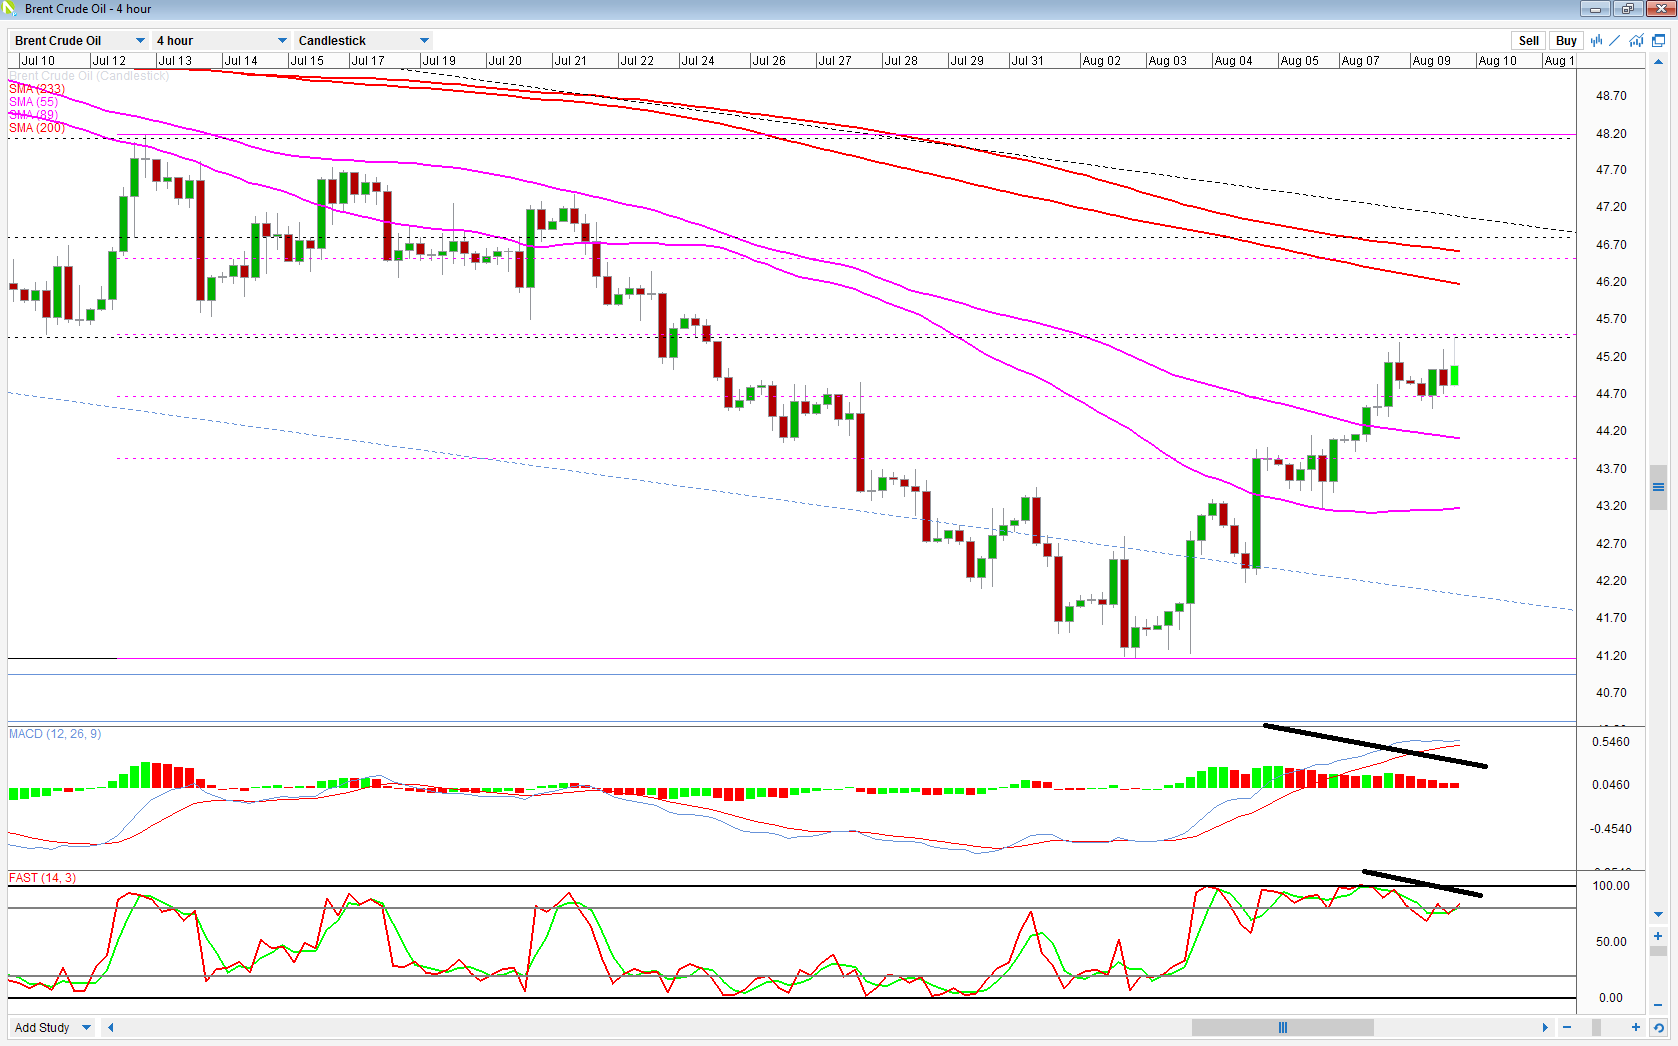
Should we break below today’s low – $44.50 – this would look like a double top break at a key resistance level and could trigger another move to the downside, with the next key support level coming around $44, followed by $43.30-43.60. The upper end of the latter would also be the price projection point based on the size of the move from the top of the double top to the neckline.
WTI/USD – Crude at 2-week High, Punches Above $43
Alternatively, if it breaks above the current resistance level, we could be looking at a broader correction following what has been quite a substantial sell-off.
At this point $46.50-46.75 would become a key zone of interest, with it being the area at which the 89-day simple moving average intersects the 76.4% retracement of the earlier mentioned move, the 50% retracement of the move from June’s high to last week’s low, and a prior zone of support and resistance.
