Energy prices are higher on rising geopolitical tensions with precious metals also in demand on safe haven plays. Industrial metals are under-performing on weak China data while the agricultural sector was lifted by reports of China agreeing to buy US agricultural produce as part of the ongoing trade negotiations.
Energy
CRUDE OIL prices surged at the start of the week following the weekend drone attack on Saudi oil production facilities, which cut off about half of the Kingdom’s daily production, the equivalent of 5% of global supply. The Kingdom has is said to be on track to restore half of the lost production, but recovering the balance could take weeks. US President Trump said the US Strategic Petroleum Reserve, which currently stands at 660 million barrels, would be made available to ensure supply and calm markets.
Russia’s Energy Minister reckons that global oil reserves will be sufficient to cover the shortfall from Saudi Arabia’s lost production, and said yesterday that there is probably no need to convene an emergency OPEC+ meeting.
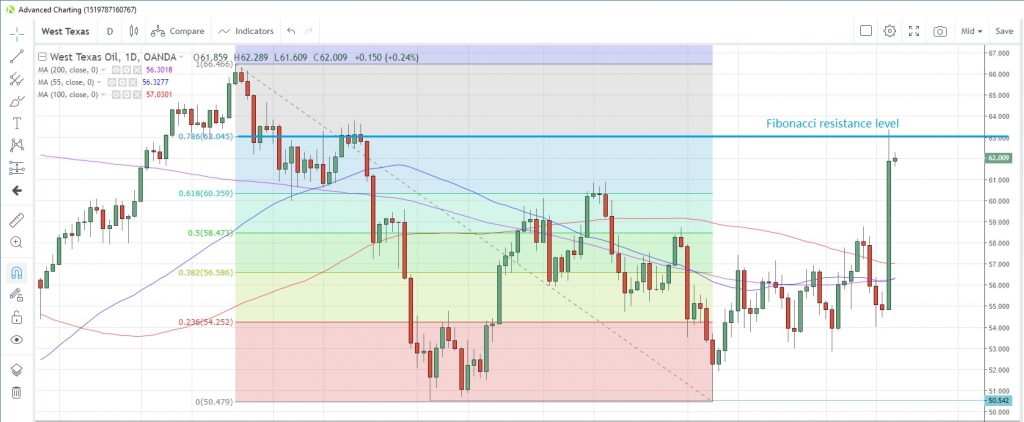
Prices jumped the most on record yesterday before closing 12.8% higher. The 78.6% Fibonacci retracement of the April-August drop is at $63.045 and had capped prices on a closing basis for now.
WTI Daily Chart
Speculative investors, including hedge funds, were well positioned for the move higher, having increased net long positions for the first time in three weeks to September 10, boosting net long positions to the highest since the week of May 28, according to the latest data from CFTC.
NATURAL GAS prices rose to the highest since April 11 yesterday as oil prices surged, flirting with the 200-day moving average at 2.6785 for the first time since January 25. Anticipated higher temperatures across the US in the September 23-29 period was already lifting prices before the Saudi Arabia news, lifting prices for three straight days.
The recent rally has seen speculative investors scaling back net short positions for the last four weeks, and they are now at the lowest since the week of June 18. Last month, China’s natural gas output increased 6.6% y/y to 13.8 billion cubic meters.
Precious metals
GOLD has started the week positively amid safe haven buying and is facing its first up-week in four weeks. Despite the surge in oil prices and heightened geopolitical tensions, gold only managed a 1.5% rally at the most yesterday and is now back below the 1,500 mark. The 55-day moving average has been rising since June and is now at 1,471.86.
The lack of upward momentum through 1,560 has seen many speculative investors lose patience, so net long positions have been scaled back to the lowest level in six weeks, according to data as at September 10 from CFTC. Exchange-traded funds (ETFs) have also been selling the precious metal for the past five days, with the last session seeing the biggest amount sold since August 13,according to Bloomberg reports yesterday.
SILVER rebounded from three-week lows yesterday amid heightened geopolitical tensions. The metal jumped the most in two weeks, which pulled the gold/silver (Mint) ratio off three-week highs. The ratio is shying away from the 200-day moving average at 86.20. Speculative investors turned net sellers of silver for the first time in four weeks, CFTC data to September 10 show.
PALLADIUM touched a new record high yesterday before closing lower for the second day in a row. In the run up to the record high, palladium had posted six consecutive weekly gains, the longest run since June/July 2016. Speculative investors have been embracing the rally, increasing net long positions to the highest since July 30, according to the latest CFTC data as at September 10.
PLATINUM declined for the first time in four weeks last week and seems to be extending those losses into a second week. Speculative investors are still bullish however, boosting net long positions for a third straight week and lifting them to the highest in 18 months in the week to September 10, CFTC data show.
Wage talks between producers and South Africa’s largest platinum-mining union have been deadlocked for more than a week, with the producers seeking independent arbitration, which could have a negative impact on supply going forward.
Base metals
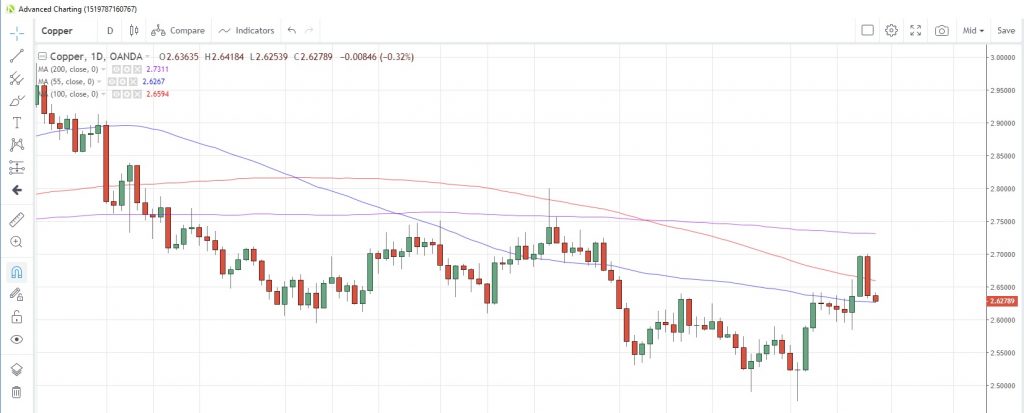
COPPER prices fell the most in more than four months yesterday after China’s August industrial production data came in at the lowest level in more than 15 years. This raised concerns about future demand for the industrial metal and saw prices retreat from seven week highs. Speculative investors, including hedge funds, trimmed their net short positions for the first time in three weeks in the week to September 10. They are now the least since the week of July 30.
Copper Daily Chart
Agriculturals
CORN’s three-day rally into yesterday was the longest bullish run since July, pulling prices to the highest level this month amid speculation that ethanol demand, of which corn is a main ingredient, might pick up if the oil production outage in Saudi Arabia continues for some time. Speculative investors have been wrongly positioned for this latest upmove, having been net sellers for the past eight weeks, turning net short on the commodity last week for the first time since May.
SUGAR rose for a second consecutive day yesterday and, if these gains can be maintained throughout this week, could be facing its first up-week in eight weeks. Prices had touched a near one-year low last Thursday amid concerns about excess supply. Rains are forecast for India’s sugarcane growing areas for most of this week, which could benefit crops that are due to be harvested next month, potentially adding to supply.
Speculative accounts remain bearish on sugar, with net short positions now at the highest on record after six straight weeks of net selling.
SOYBEANS posted the biggest weekly gain of almost 5% last week, the most since June, amid reports that China had agreed to buy more US agricultural products as part of the trade war negotiations. Prices hit the highest since July 25 yesterday and look poised for a fourth consecutive day of gains today. Speculative investors boosted net short positions to the highest since the week of June 11.
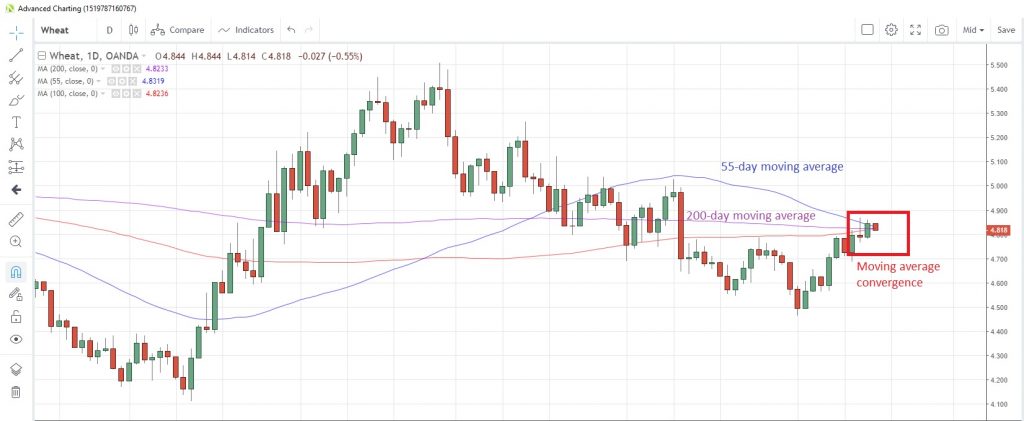
WHEAT has been flirting with the 55-day moving average, now at 4.8320, for the past three days but has failed to sustain any break above it. Within a 4.8233 to 4.8320 range we have three moving averages converging. The 55-day at 4.8320, the 100-day at 4.8236 and the 200-day at 4.8233. With prices now at 4.8210, the resistance may be a tough level to crack in the near term.
Wheat Daily Chart


