The copper market can be a confusing beast. Along with iron ore, it is that most bellwether of the commodities to the health of the global economy.
It is rather surprising then that as oil and natural gas rally, coking coal hits new highs on the Dalian Futures Exchange and drags iron ore with it; Copper has stubbornly refused to join the party. Instead, it has traded sideways in an ever contracting triangle for the last year. Most recently at the bottom side of it.
Part of this may be due to Opec in the case of oil, the rising price of Steel in the case of iron ore and coal. (btw if someone could tell me where all of the excess steel is going to be sold I’d love to be enlightened!) Better than expected European Manufacturing PMI’s overnight gave another leg up to iron, coal, and copper although it was a laggard to the other two. With flat to middling data from China and the USA and one good number from Europe, it seems like a reach to be saying the world economy is bottoming out.
Part of the answer lies in the production outlook for copper. Whereas coal and iron have seen an aggressive paring of capacity with large numbers of mines, in Chinese coal particularly, being closed or mothballed: copper producers are aggressively expanding capacity. The top 20 producers (60% of world production) increasing year on year output by 5% in 2016 and up to 15% in coming quarters according to Mining.com.
Whether copper producers turn out to be fortuitous countercyclical investors or are catching a falling knife remains to be seen.
From a technical perspective, copper is consolidating in a symmetrical triangle pattern. The pattern itself looks suspiciously like a bear market consolidation before a move down when viewed on a weekly chart.
Copper Weekly
The chart shows a well-established downtrend line dating back to 2012, sitting today at the 2.4300 area, with the 100-week moving average just above at 2.4600. Below Can be seen the consolidation pattern in the bear trend.

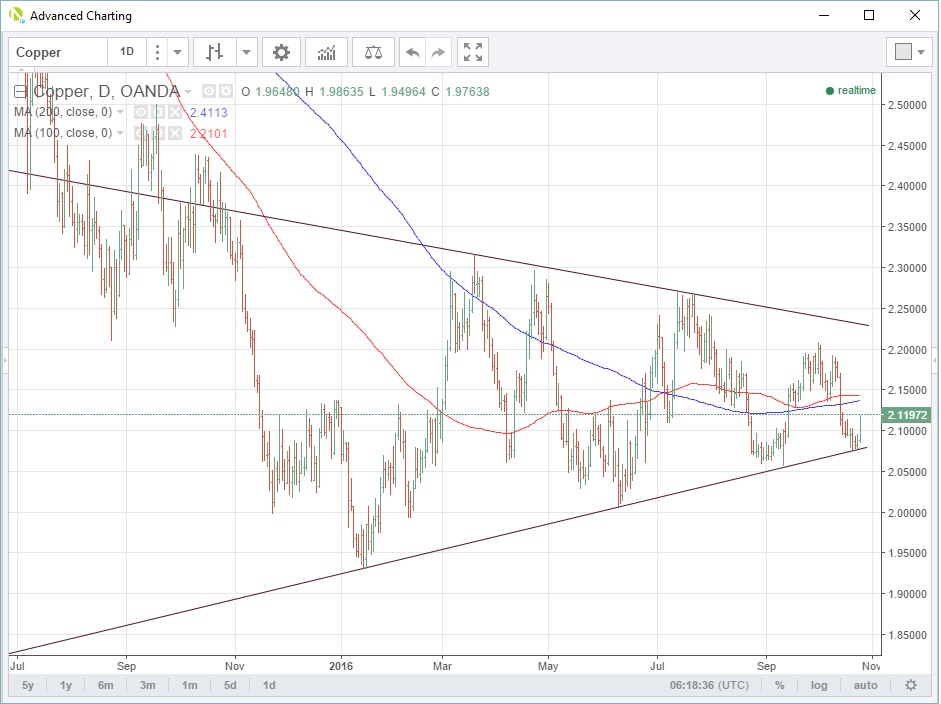
Copper Daily
Zooming into the daily chart we see much more clearly the triangle/consolidation pattern. The coal and iron ore rally have lifted copper of its trendline support, today at 2.0800, having tested it multiple times in the last week. Resistance appears above at 2.1365 and 2.1435, the 200 and 100-day moving averages.
Resistance appears above at 2.1365 and 2.1435, the 200 and 100-day moving averages. Above there, the descending trendline of the triangle comes in at 2.2300.
The triangle is fast converging so a breakout is coming soon. The weight of probabilities suggests the downside but that would need a daily close below 2.0700 I feel.
Summary
Although the charts look very bearish, until the triangle is apparently broken caution is merited. The production overhang vis a vis the iron ore and coal producers means that copper will likely struggle to maintain a sustained rally unless global economic data stages a remarkable comeback into the end of Q4.