The index found dynamic resistance at 200 SMA (H1 chart) and that
helped to block the bulls’ advance across the board during Monday’s
session. The support zone of 101.96 is being challenged and a
consolidation below that area should expose the next key support
around 101.39, which should help to strengthen the bears in the
short-term. To the upside, the next resistance lies at the 102.30
level.
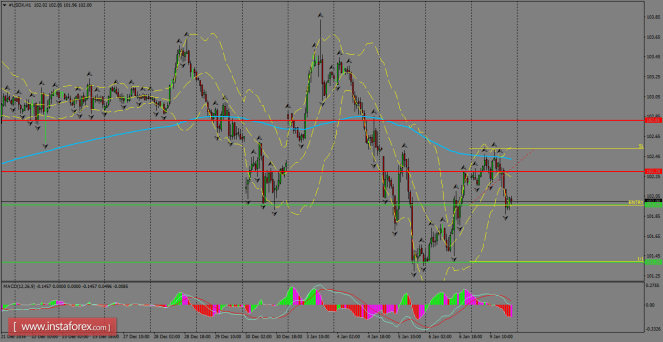
H1 chart’s resistance
levels: 102.29 / 102.81
H1 chart’s support levels:
101.96 / 101.39
Trading recommendations for today:
Based on the H1 chart, place
sell (short)
orders only if the USD Index
breaks with
a bearish
candlestick;
the support
level is at
101.96,
take profit is at
101.39
and stop loss is at 102.54.
The material has been provided by InstaForex Company – www.instaforex.com
The post Daily analysis of USDX for January 10, 2017 appeared first on forex-analytics.press.