Daily Markets Broadcast

2018-10-24
Wall Street rebounds strongly after testing 3 1/2 month lows
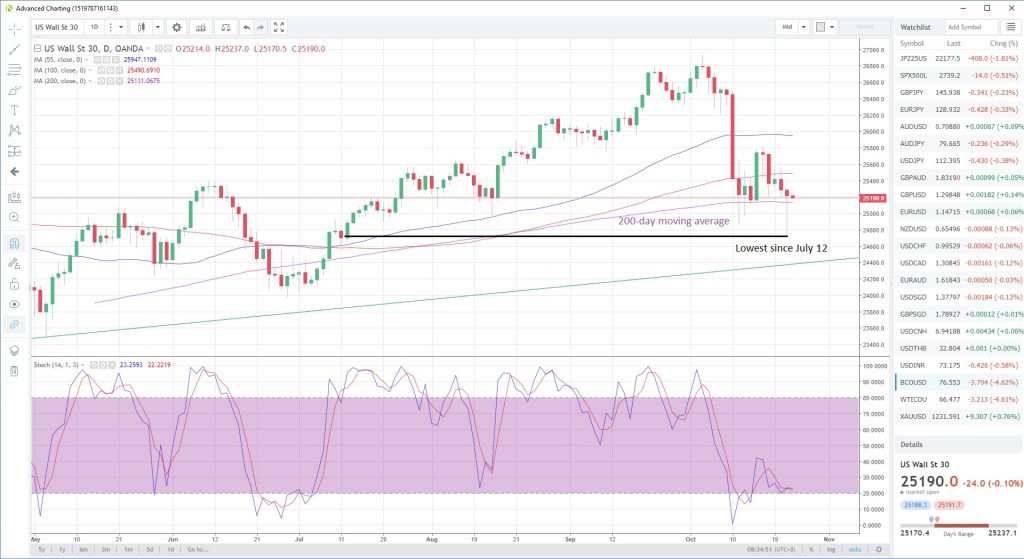
It was another volatile session on Wall Street yesterday, with indices testing multi-month lows before a strong rebound. The recovery was dented by unimpressive company earnings reports, and all indices closed in the red. Indices appear to be struggling for traction at the open this morning.
US30USD Daily Chart
-
It was another volatile session for the US30 index yesterday, with early weakness prompting a strong rebound, though it still closed down on the day as earnings reports generally disappointed
-
The index has regained a foothold above the 200-day moving average at 25,131. It still has failed to close below the moving average since July 5, despite four attempts in the last two weeks
-
Markit manufacturing PMI reading for Oct is due today and is expected to hold steady at 55.5 after a 55.6 print the previous month. A higher number could help the index. We also have speeches from Fed’s Bullard, Bostic and Mester.
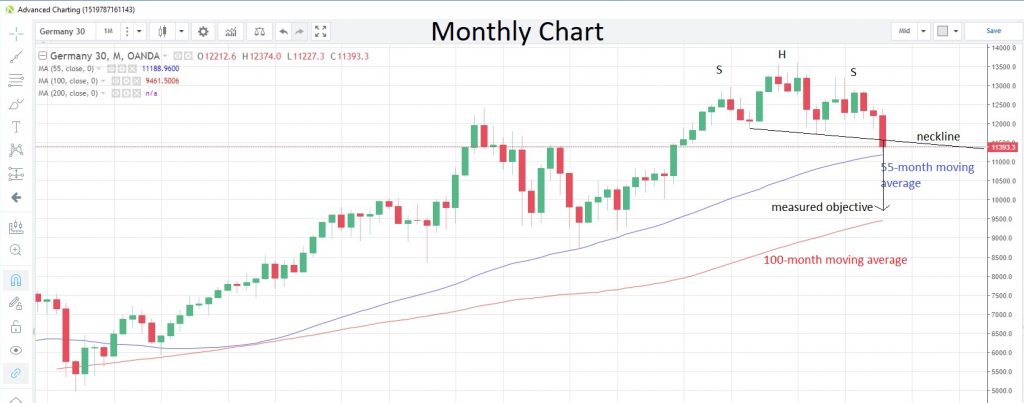
DE30EUR Monthly Chart
-
The Germany30 index touched the lowest level since December 2016 yesterday as a higher PPI reading stoked fears of pipeline inflation brewing, which could prompt the ECB into raising rates earlier than is currently expected
-
The index closed below the 200-week moving average for the first time since February 2016. The 55-month moving average is at 11,188 and has supported the index since February 2016 as well. A head-and-shoulders reversal pattern has unfolded on the monthly chart, crossing below the neckline yesterday, which would have a measured objective just below the 10,000 mark
-
Germany’s Market Oct manufacturing PMI is due today and is expected to ease off to 53.4 from 53.7 in Sep. A softer-than-expected reading could hurt the index.
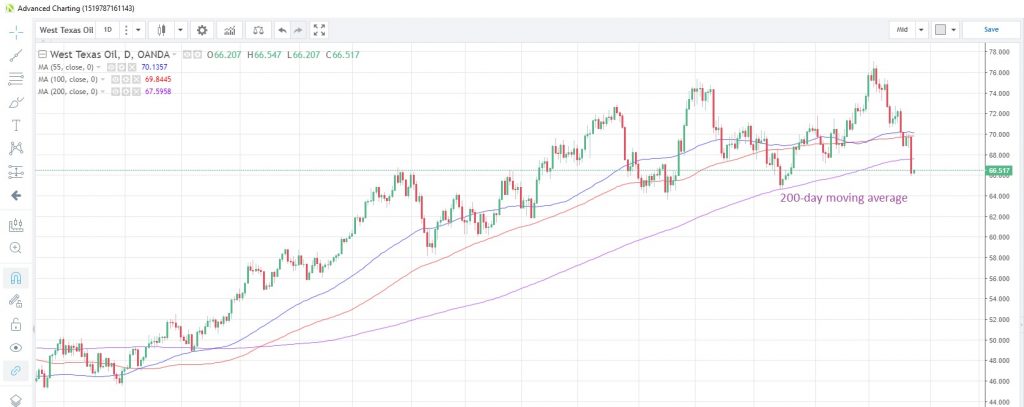
WTICOUSD Daily Chart
-
Oil prices fell to their lowest level since August 20 yesterday as Saudi Arabia pledged to meet any supply shortfall from the Iran sanctions, which kick in next month
-
WTI closed below the 200-day moving average for the first time since October 2017. The 55-week moving average offers the next support at $64.94
-
EIA releases weekly oil stocks data later today. Expected to show an increase of 3.55m barrels following last week’s add of 6.49m barrels. A smaller add, or a drawdown of stocks would be bullish for prices.


