DJIA Failed At Key Resistance, Pushed Back Below 18,000
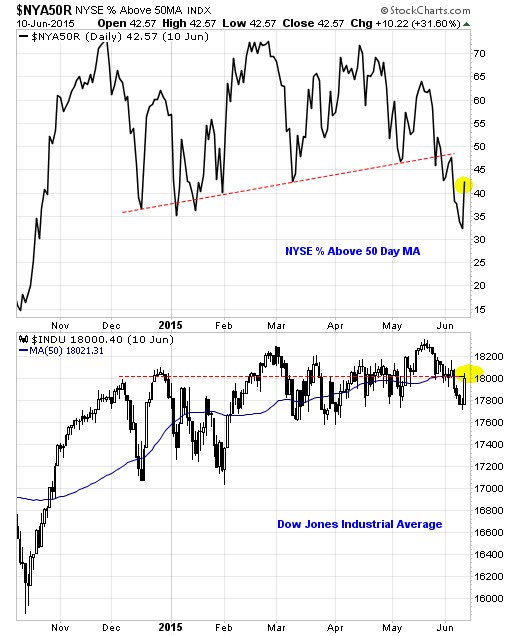
The Dow Jones Industrial Average (DJIA) was pushed back below 18,000 last week, a mark it 1st tested in December 2014.
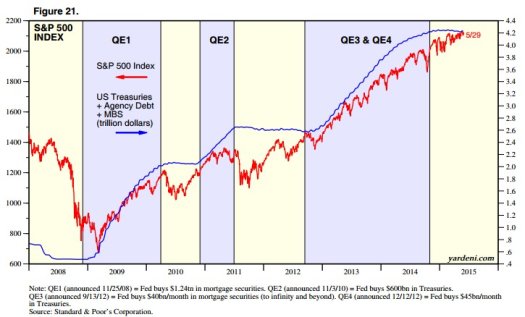
You will recall that was when the Fed ended bond-buying stimulus. The end of prior QE’s in Ys 2010 and 2011 were followed by sharp market selloffs, as shown in the 1st chart below.
This time however, stocks have been range bound, and the S&P 500 has not seen a pullback 10% or more since early 2012. Shayne and I are expecting that to end soon.
The market looks to be waiting for a resolution on 2 Key issues:
1. The Greek bailout negotiations, as Athens is set to default on its debt repayments to the International Monetary Fund totaling $1.8-B if no deal is done before 30 June. Stocks posted their best 1-day gainer in a month last Wednesday on reports Germany would be open to a piecemeal compromise deal. Stocks then trimmed gains Thursday on reports the IMF had pulled its negotiating team due to a lack of progress. A deal remains a long way off as of this writing according to reports.
2. The timing and pace of short-term interest rate hikes from the Fed this year, which would be the 1st policy tightening since Y 2006. Some say September, some say July, many are saying not till Y 20016, a few say never..
The Greek issue does not appear to be of significant importance, the Fed’s actions are more likely to rattle stock markets. Then there is the “Black Swan”, that could be the Q-2 US GDP numbers instead of coming in at the projected 1.9% growth, to post as really big miss or contract pushing the US into recession, that would really cause trouble, stock markets crash on recessions.
Whatever occurs, the savvy market participants are nervous and have been going to cash since December, thus showing the DJIA hanging to the 18,000 mark.
A technical analysis pattern dubbed the Hindenberg Omen happend Thursday on divergences between price, new highs, new lows and advancing and declining measures of market internals.
Look at the way the percentage of NYSE stocks above their 50-Day MAs has been rolling over since late May, as shown in the chart above.
While not a perfect signal Hindenburg Omens have in the past been reliable warnings of approaching market weakness since they reflect a withdrawal of broad buying interest. As has been happening since last December
Note: HO’s have appeared many times in recent years without being followed by massive selloffs.
The Key here is as breadth weakens, the market is relying on fewer and fewer stocks to stay up in the Ozone.
Apple (NASDAQ:AAPL) for instance is currently tracking to a historic degree, a concept known as statistical correlation. Meaning that while AAPL distracts, the ra growing percentage of less closely followed stocks rollover
Also, while people focus on headlines out of Greece or on every other economic data point for its impact on Fed policy, the fundamental justification for Dow 18,000 continues to decline.
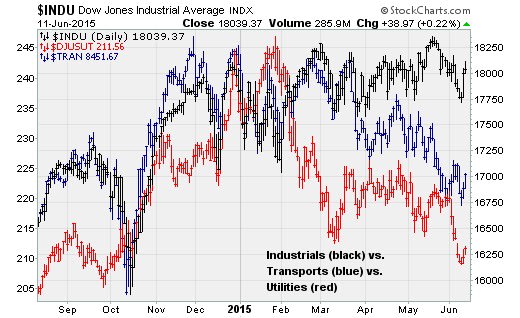
Also, the Dow Theory is flashing a warning sign, as the DJIA stands near record highs while transportation and utility stocks have declined. All 3 peaked in unison at the end of Y 2014 but have been diverging ever since. Transports are down 9.1% from their high, and utilities are down more than 14%.
And lastly, the combination of still-low energy prices, a tightening job market, rising labor costs and tepid GDP growth continues to weigh on corporate revenue growth. Given the surge of corporate borrowing and the additional leverage on balance sheets, funding debt-fueled share buybacks and dividends, this is a problem since companies have increased their capital spending on how sensitive net earnings are to changes in revenue growth..
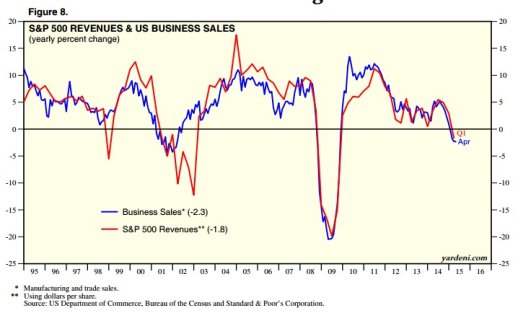
The chart above shows how business sales are falling at a 2.3% annual rate, suggesting downside ahead for S&P 500 revenues.
This rate of decline aligns with the start of the last 2 recessions. Not even the Y 1998 mid-cycle slowdown featured a pullback of this size. The pressure from both lower Crude Oil prices, and from a tighter job market will continue.
We know that the Greek issues with be resolved Up or Down Greece, there may come clarity on the Fed’s rate hike timing, and begin Q-2 earnings season will come.
So, based on market breadth and Dow Theory, stocks should begin to pullback at least 10%, and perhaps correct deeper.
Have a terrific weekend.
HeffX-LTN
Paul Ebeling
The post DJIA Failed At Key Resistance, Pushed Back Below 18,000 appeared first on Live Trading News.