Submitted by Lance Roberts via RealInvestmentAdvice.com,
YELLEN IS YELLIN’ & THE MARKET’S ARE LISTENIN’
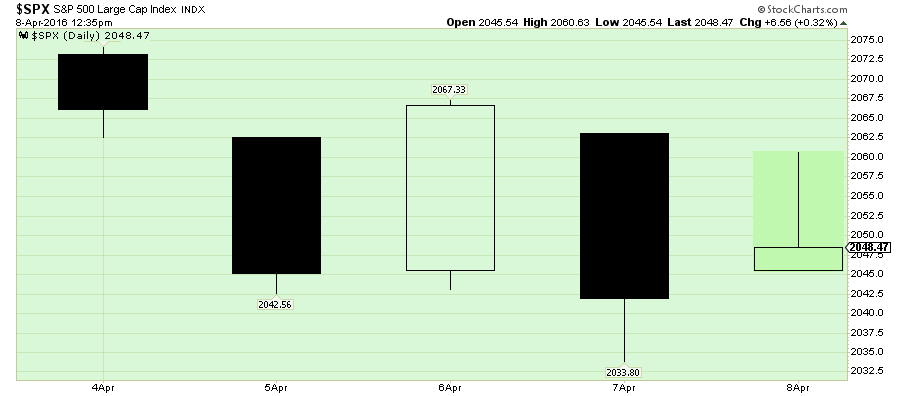
If you like volatility, you had to love this past week. After sliding 22 points on Tuesday, the market rebounded sharply on Wednesday, gave up those plus more on Thursday, and as of Friday is struggling to stay positive.
The spike on Wednesday followed the release of the FOMC minutes which confirmed “bad news is still good news” for the markets as global weakness is keeping the Fed from hiking rates. The surge out of the gate on Friday was again “Fed Speak” as Fed President William Dudley continued “dovish” comments suggesting no rush to hiking rates anytime soon. To wit:
“Caution is needed because of our limited ability to reduce the policy rate to respond to adverse developments, recognizing that we could also use forward guidance and balance sheet policies to provide additional accommodation if that proved warranted.
Although the downside risks have diminished since earlier in the year, I still judge the balance of risks to my inflation and growth outlooks to be tilted slightly to the downside.“
And with those “silky smooth” words, traders rushed to buy stocks as the risk of tighter monetary policy continues to pushed further out into the future. Like the cartoon shows, courtesy of Hedgeye, the only thing that matters to the markets right now is the Fed.
Of course, while the Fed continues to talk about the need to hike rates in the future as inflationary pressures rise due to strong economic growth. A quick look at the Atlanta Fed’s GDPNow shows a bit of different story.
“The GDPNow model forecast for real GDP growth (seasonally adjusted annual rate) in the first quarter of 2016 is 0.1 percent on April 8, down from 0.4 percent on April 5. After this morning’s wholesale trade report from the U.S. Bureau of the Census, the forecast for the contribution of inventory investment to first-quarter real GDP growth fell from –0.4 percentage points to –0.7 percentage points.”
It is worth noting on February 14th, the estimate for Q1 economic growth was ringing in at 2.7%. With earnings deteriorating and economic growth collapsing the ability for the Fed to raise rates remains a proverbial “Unicorn.”
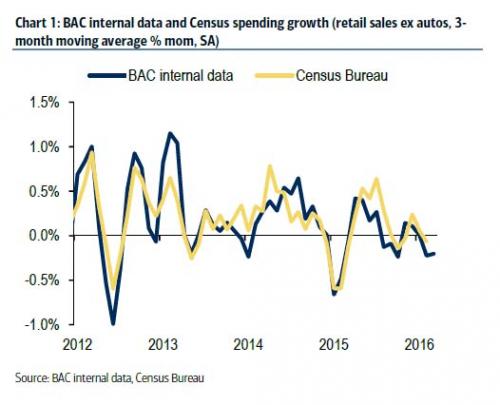
Of course, with consumer spending slowing sharply it is no wonder corporate profits, a direct reflection of real consumption, are getting weaker. The chart below, from BankAmerica, shows the seasonally adjusted retail sales ex-autos measure from the BAC aggregate card data was unchanged SA in March, leaving the 3-month moving average to decline 0.2%. While a part of this weakness owes to a continued decline in gasoline prices. We find that retail sales ex-autos and gasoline was up 0.3% mom SA, which continues to be in a downward trend.
This confirms the downward revision to the Census Bureau data in January which made government data more consistent with the BAC internal data. According to Bank of America:
“We therefore also look for only a slight improvement in March Census Bureau sales, in a similar pattern as the BAC internal data.“
In other words, Q1 GDP is weak for a very specific reason: consumer spending remains anemic.
But wait, low oil and gasoline prices were supposed to provide a boost to consumers wallets?
That was always a grossly flawed and incorrect economic theory. As I explained in detail in “Falling Energy Costs & The Economic Impact:”
“Simply put, lower oil and gasoline prices may have a bigger detraction on the economy that the ‘savings’ provided to consumers.”
Earnings Season Begins, But May Be Disappointing
As we head into earnings season, estimates have been lowered, beaten down, crushed and lowered some more. So, when you lower the bar far enough, you shouldn’t be surprised to see a large number of companies, after share buybacks, accounting gimmicks, and cost cutting winning the “beat the estimate” game.
You can see the negative revisions in Dr. Ed Yardeni’s chart below.

But it is actually much worse than that. I keep track of the changes in S&P 500 estimates and reality and update a report at the end of each quarter. (See Latest Here)
The chart below from Goldman Sachs, from November of 2014, expected corporate profits to surge in the coming years with 2015 ending at $122/share. As long as earnings keep accelerating higher, a P/E multiple of 17x earnings can be maintained indefinitely into the future.
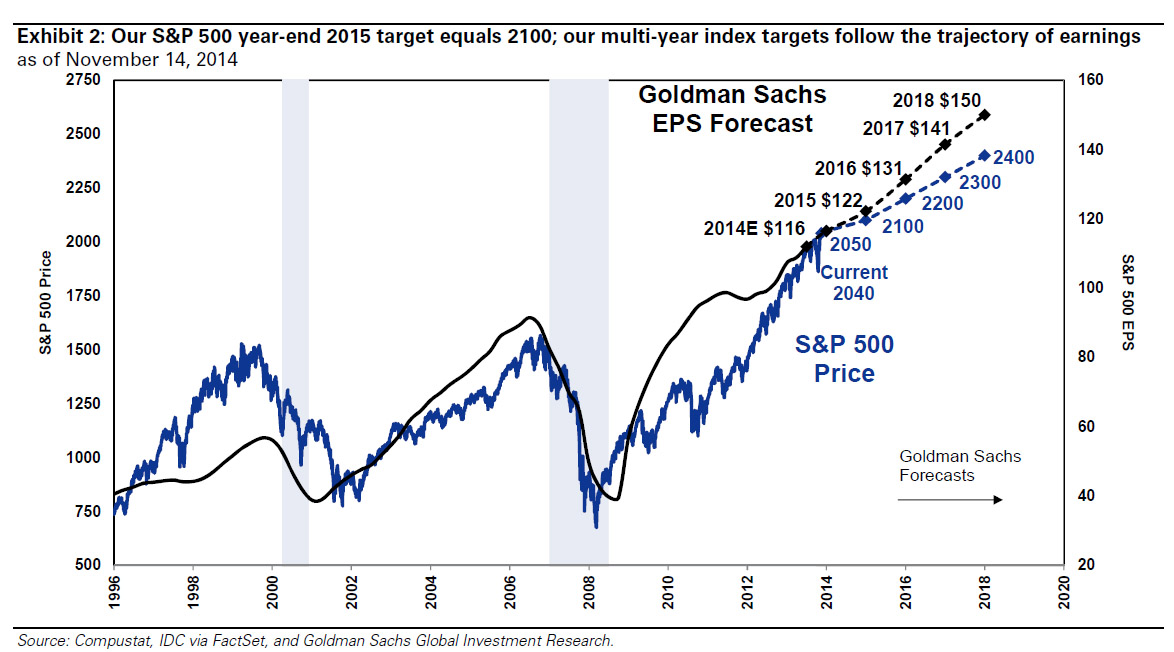
Clearly, one should buy stocks today and hold them long-term given such an incredible undervaluation, right?
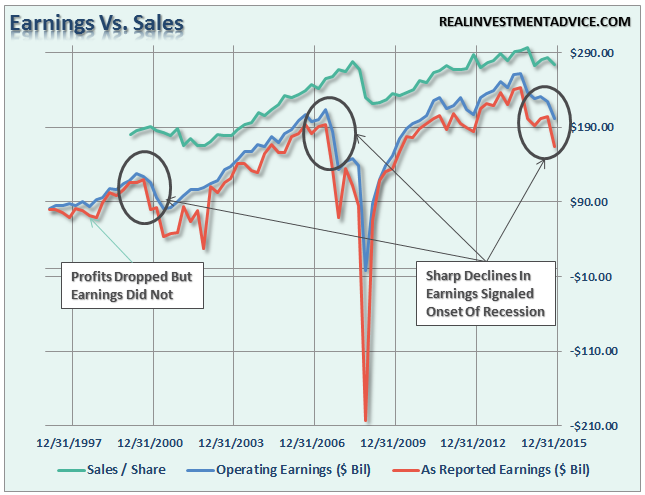
The problem is the is the huge disparity between expectations and reality as shown in the chart below which compares economic growth to earnings growth. Wall Street has always extrapolated earnings growth indefinitely into the future without taking into account the effects of the normal economic and business cycles. This was the same in 2000 and 2007. Unfortunately, the economy neither forgets nor forgives.
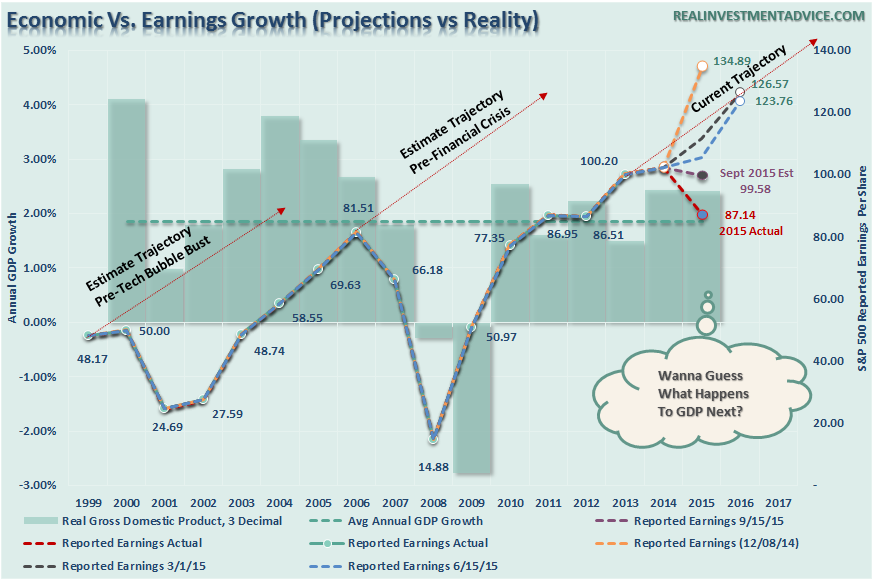
With estimates once again very optimistic, and given a complete disregard to the late stage of the current economic cycle, there is currently not one Wall Street analyst expecting a recession.
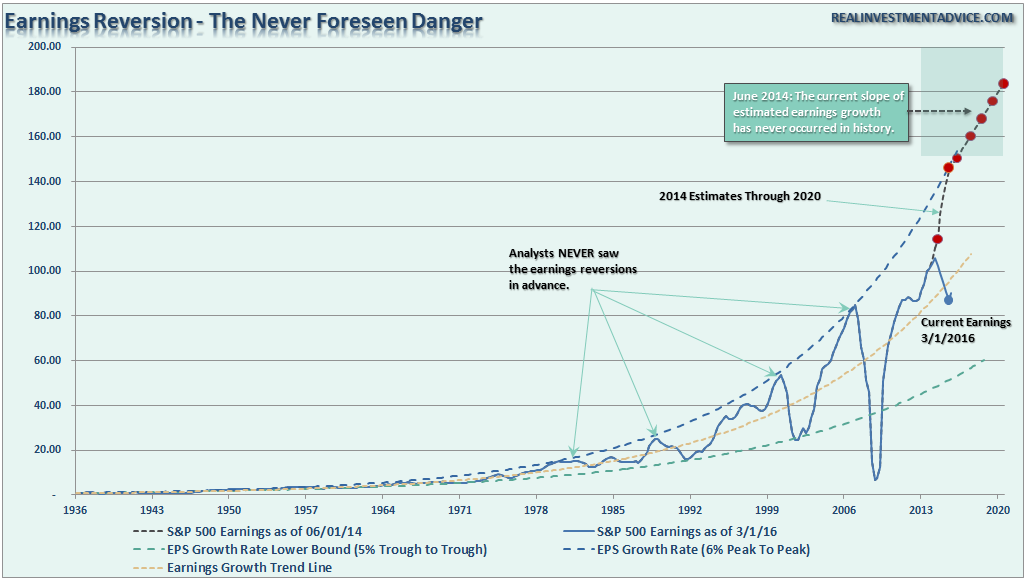
Unfortunately, it is only a function of time until the next economic downturn takes hold, particularly given the currently weak global outlook. As shown, earnings tend to cycle regularly between 6% peak to peak and 5% trough to trough growth in earnings. In 2014, expectations exceeded the current 6% peak to peak growth rate. I said then that it was only a question of what will trip up such overly optimistic picture. We now have that answer and real earnings have fallen far short of those original estimates.
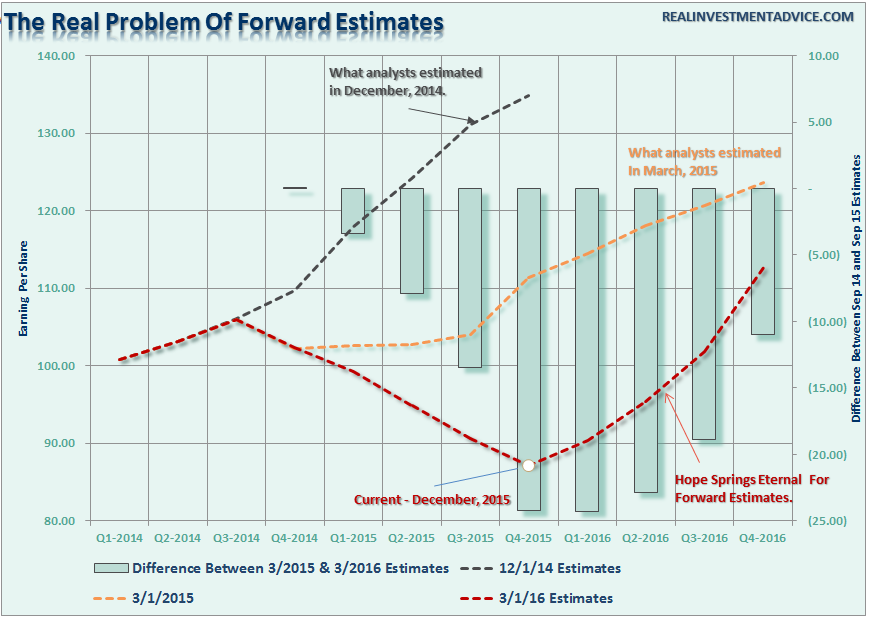
The problem with forward earnings estimates is that they consistently overestimate reality by roughly 33% historically. The chart below shows the consistently sliding revisions of analyst expectations versus the reality of corporate profitability. At the end of 2014, it was estimated that by Q4 of 2015 reported earnings would reach in excess of $131.00. However, Standard & Poors then revised down their estimates to just $104.03 at the end of Q1 in 2015. We are now looking at just $86.53 a share for 2015. What a miss.
The illusion of“permanent liquidity,” and the belief of sustained economic growth, despite slowing in China, Japan, and the Eurozone, has emboldened analysts to continue push estimates of corporate profit growth higher. Even now, as the earnings recession deepens, hopes of a sharp rebound in profitability remains ebullient despite the lack of any signs of economic re-acceleration.
However, despite the disaster in earnings over the last quarter, future expectations continue to be focused on a sharp recovery through the end of this year. As noted by BCA Research:
“A broad-based EPS contraction has already caused havoc in the overall market in recent months, but a more painful downturn has been averted because nominal GDP growth has managed to stay above long-term Treasury yields. However, leading economic indicators remain bearish, and the slide in the monetary base warns that the path of least resistance for GDP growth is lower. History shows that once GDP growth dips below the level of 10-year Treasury yields, a prolonged slump in stocks typically ensues.
To be sure, U.S. profits key off the state of the global economy, not just domestic trends. According to our Global Leading Economic Indicator (GLEI), growth is also too weak outside the U.S. to expect a profit turnaround. The GLEI is correlated with U.S. net earnings revisions, which are currently deeply negative following several consecutive quarters of poor operating profits across the corporate sector.
This outlook contrasts starkly with current expectations. The Chart below shows that an aggressive recovery in S&P 500 earnings is expected this year.”

“Importantly, these expectations are not simply a reflection of hopes for a recovery in resource prices, but are broad-based across sectors. That is wildly optimistic, underscoring that disappointment will remain a key risk.
It is too ambitious to expect equity risk premiums to narrow given such a large gap between reality and expectations. Our U.S. equity strategists remain comfortable with a defensive sector portfolio structure, and caution against chasing the recent bounce in the bulk of cyclical sectors.“
I could not agree more with BCA’s comments.
Economic growth is a function of consumption. If economic growth is weak, then consumption must therefore also be weak. If consumption is weak, then corporate revenues will also be weak. As shown below, declines in revenue have been a strong precursor to economic recessions. Of course, while accounting gimmicks and share buybacks can buoy profits temporarily, it is not sustainable and the eventual downturn is inevitable.
The point here is that while prices have improved short-term, which have been a function of the “verbal easing” issued by the Fed, the underlying realities of the market are far different. As is always the case, estimates are likely to fall sharply as economic reality continues to take hold.
Why anyone pays attention for forward estimates is beyond me given a 90% miss rate. Remember that the next time someone tells you that “stocks are cheap based on forward estimates.”
Could prices maintain their current levels long enough for the economic cycle to turn and catch up? Possibly. It has just never occurred before in history….ever.
This Looks Awfully Familiar
While allocations have been very conservative since last May, avoiding the ensuing volatile declines last summer and the start of this year, I noted last week the markets had improved technically in the VERY SHORT-TERM which could allow for an increase in equity exposure.
I have updated the analysis from last week through Friday’s close.
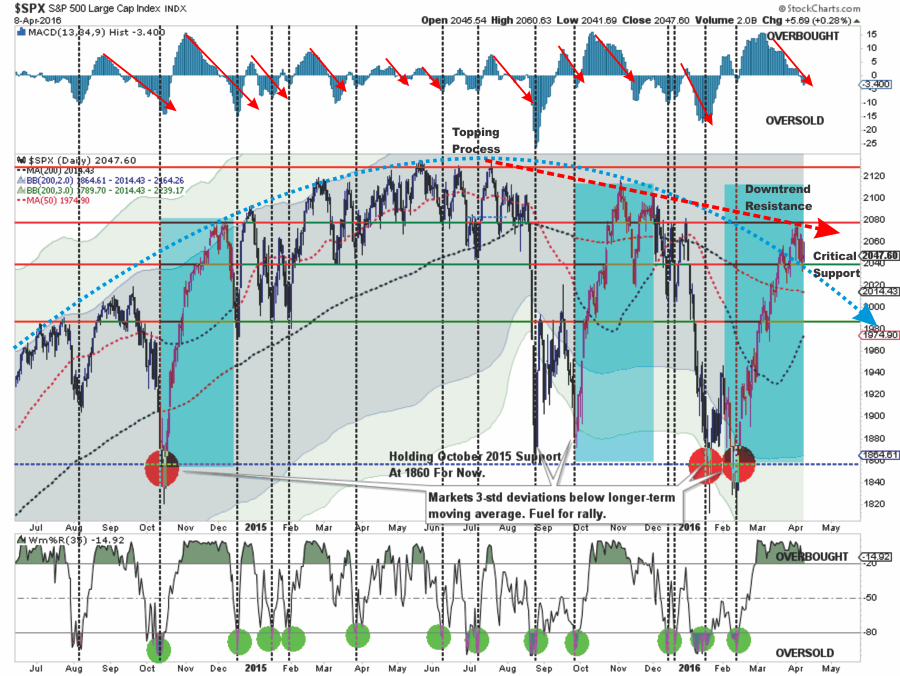
1. The shaded areas represent 2 and 3-standard deviations of price movement from the 125-day moving average. I am using a longer-term moving average here to represent more extreme price extensions of the index. The last 4-times prices were 3-standard deviations below the moving average, the subsequent rallies were very sharp as short positions were forced to cover. Not surprisingly, the recent rally was just as sharp as the last two.
2. The top and bottom of the chart show the overbought/sold conditions of the market. The recent rally has responded as expected from recent oversold conditions. With the oversold condition now exhausted, the potential for further upside has been greatly reduced. I have notated with red arrows that when this overbought condition reverses it has marked the end of the previous rally going back to 2014.
3. The red dashed line shows the current descending trend lines that continue to provide resistance to the advance. While the recent advance is now challenging that downtrend line, the collision of resistance levels may prove a challenge to a further advance from current levels. The arching dashed blue line shows the change of overall advancing to now declining price trends.
4. The market is testing very important support at 2040. In order for the “bull market” to reassert itself, the current consolidation must continue until the current overbought condition is resolved.
As I stated last week the markets have currently registered a very short-term buy signal. It is not uncommon that such a signal would be triggered given the recent advance.
However, notice in the chart below, that following the August slide, the 50-dma crossed below the 200-dma. The ensuing rally, and subsequent choppy topping action allowed the 50-dma to cross back above the 200-dma giving an “all clear” signal to the “bulls.” That “false flag” was quickly reversed by the subsequent plunge back previous lows.
The current peak in the market is extremely similar to that of last November with the 50-dma turning up and once again approaching the 200-dma. Will this be another “head fake” in the ongoing topping process? Possibly. We will have to wait and see.
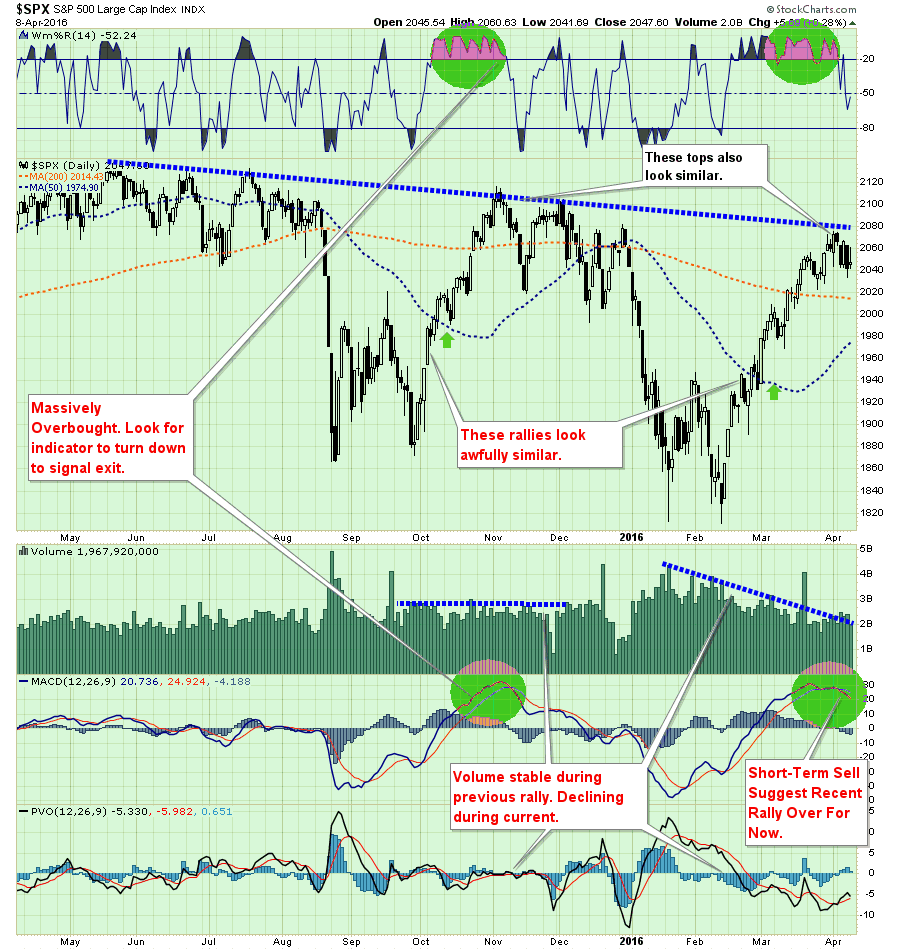
The chart above also shows more clearly the current negative trend in the market. Importantly, note the two green circles at the top and bottom of the chart. Both of these indicators are similarly positioned to the last sharp rally and market peak at the end of 2014.
With volume on rallies declining, the risk of a continued correction into next week is likely. It is critically important the market clings to support at 2020, where the 200-dma currently resides, or a deeper slide will ensue as we head into the seasonal summer weakness.
While I am on the lookout for an opportunity to modestly increase equity exposure in portfolios given better conditions, I will do so with extreme caution and very close “stop loss” levels. Given the extremely weak underlying fundamentals and NO improvement in the intermediate-term technicals of the market, I do fully expect to be “stopped out” of any additional equity exposure I may add.
“For longer-term investors, and for those close to retirement, I highly caution you against ‘chasing the market’ currently. The risk to downside far exceeds the potential for further returns in the markets currently.”
The markets have a very nasty habit of sucking individuals into the markets when prices become detached from fundamentals. Throughout history, each time such a deviation occurred, investors thought “this time was different.”
It wasn’t.
“Gravity works in the market as well as science. It takes buying to move the market up, but when buying dries up, stocks will fall of their own weight.” – Jesse Livermore
THE MONDAY MORNING CALL
The Monday Morning Call – Analysis For Active Traders
As discussed last week, there is a short-term buy signal currently in place due to the strong rally in March. To wit:
“In the chart below, you will note that the previous rallies which took the markets to very overbought short-term conditions (top part of the chart). However, those rallies did not reverse the sell-signal in the lower part of the chart.Each of these previous rallies subsequently failed taking stocks lower. This is why the allocation model remained exposed to lower levels of equity risk during this entire period.”
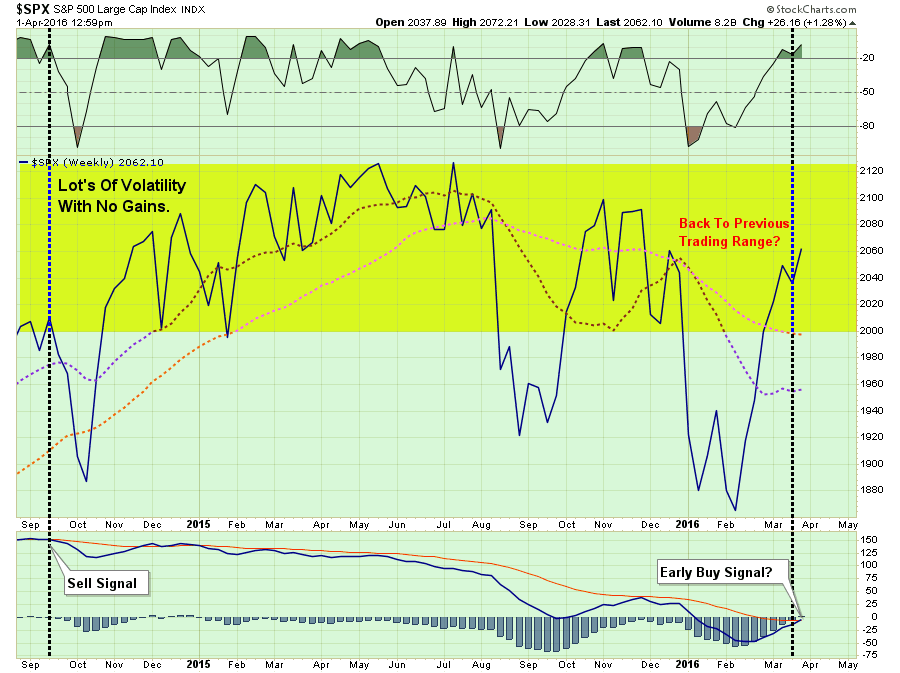
“Currently, as shown above, the short-term dynamics of the market have improved sufficiently enough to trigger an early “buy” signal. This suggests a moderate increase in equity exposure is warranted given a proper opportunity. However, to ensure that the current advance is not a “head-fake,” as repeated seen previously, the market will need to reduce the current overbought condition without violating near-term support levels OR reversing the current buy signal.”
This past week, the “backing and filling” market action began that necessary consolidation process has stayed above important support levels at the 200-dma. That process is likely not complete as of yet as shown below.
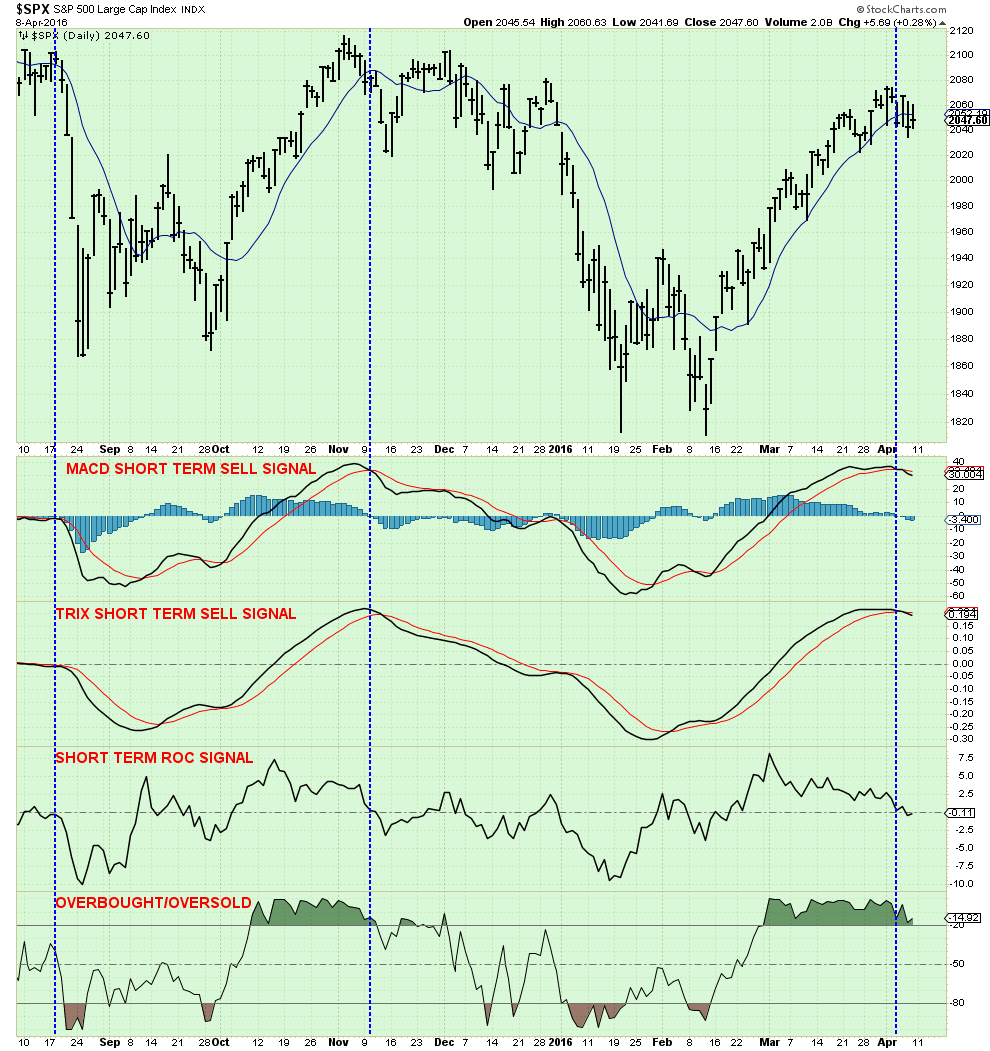
All of the very short-term signals are currently suggesting more corrective action is likely. However, as stated above, that corrective action must not violate important longer term support. If such a violation occurs over the next week or so, the opportunity to add “trading positions” to portfolios will be negated.
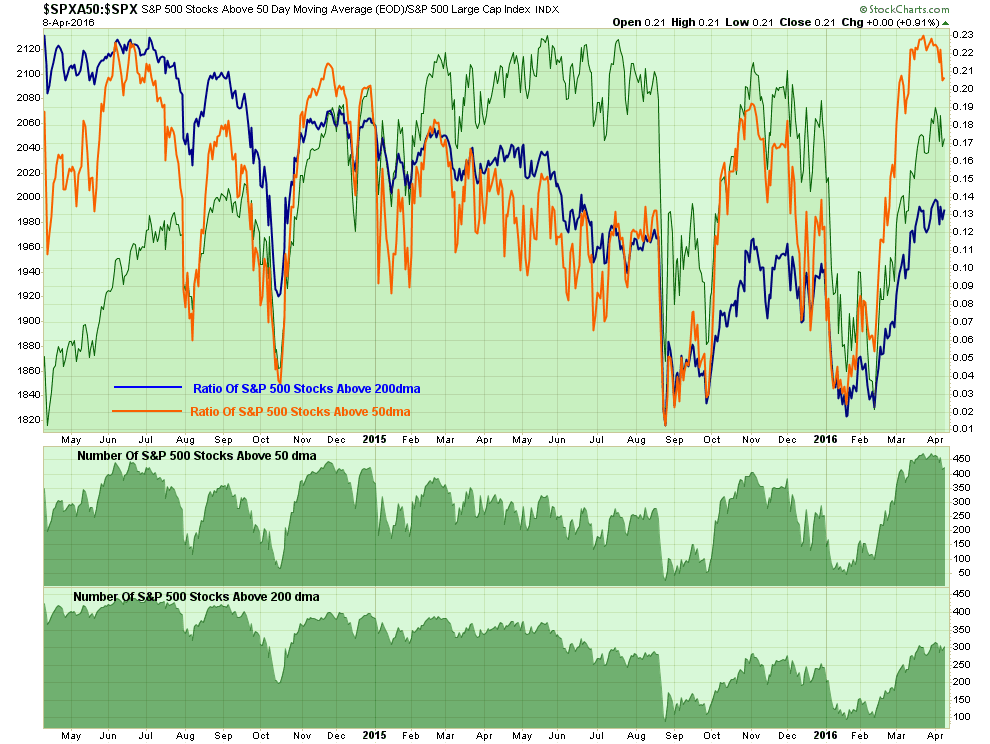
Furthermore, the short-term market breadth indicator is also rolling over confirming a short-term corrective process is likely in the works.
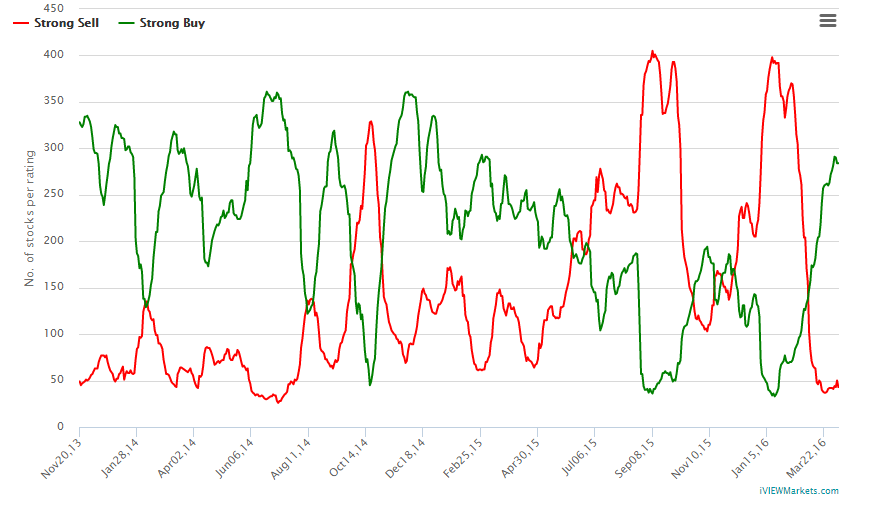
My friends over at iViewMarkets track the number of stocks on strong buys vs sells. That ratio is now approaching rather extreme levels which also confirms the current short-term overbought market condition.
I reiterate from last week:
“While the technical underpinnings of the market have improved short-term, the risk of increasing equity exposure this coming week is not favorable. However, on a pullback to support, currently 2000-2020 on the S&P 500, a tactical increase to equity exposure in the strongest sectors of the market may be viable.”

![]()
The post Earnings Implosion Looms Amid The Illusion Of “Permanent Liquidity” appeared first on crude-oil.top.