Sterling is on the rise on Tuesday, spurred on by higher than expected UK inflation data that cast doubt on whether the Bank of England will still consider easing monetary policy again this year.
The rally in the pound prompted a break of technical support against the euro, which had held over the last week as the pair consolidated at its six year highs.
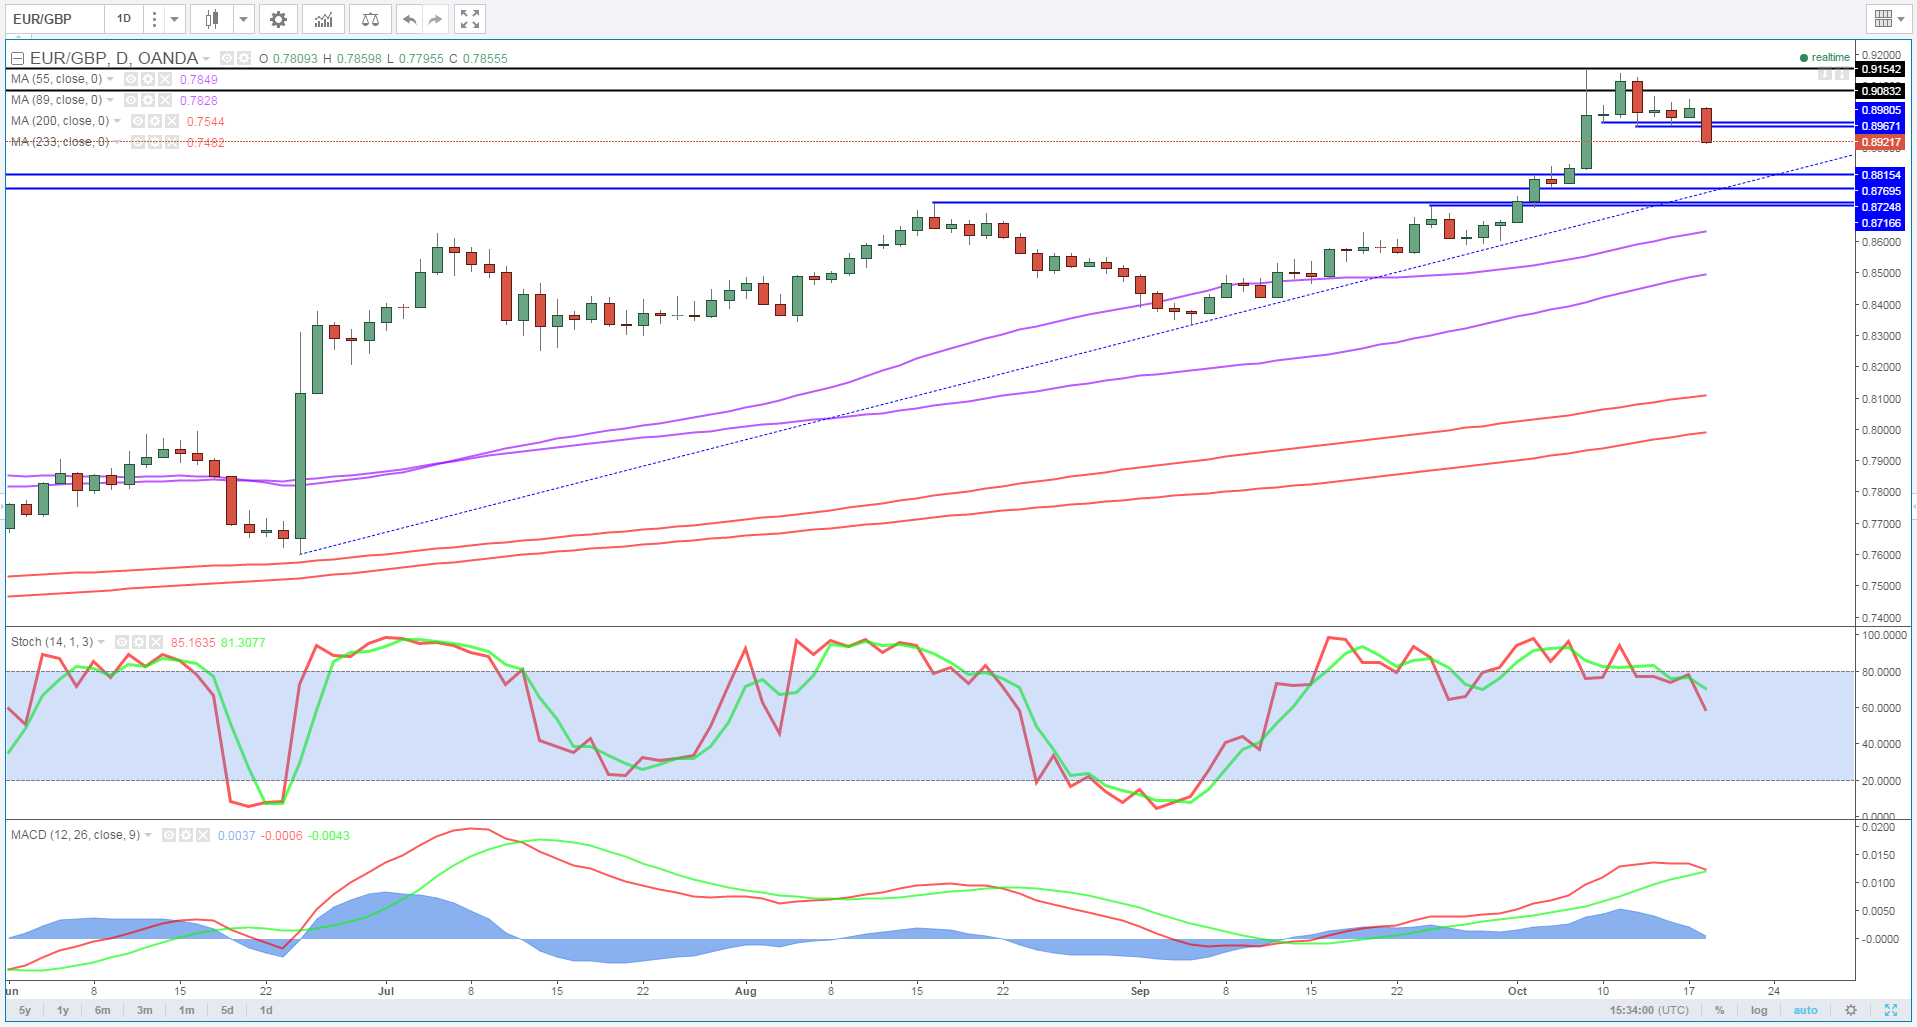
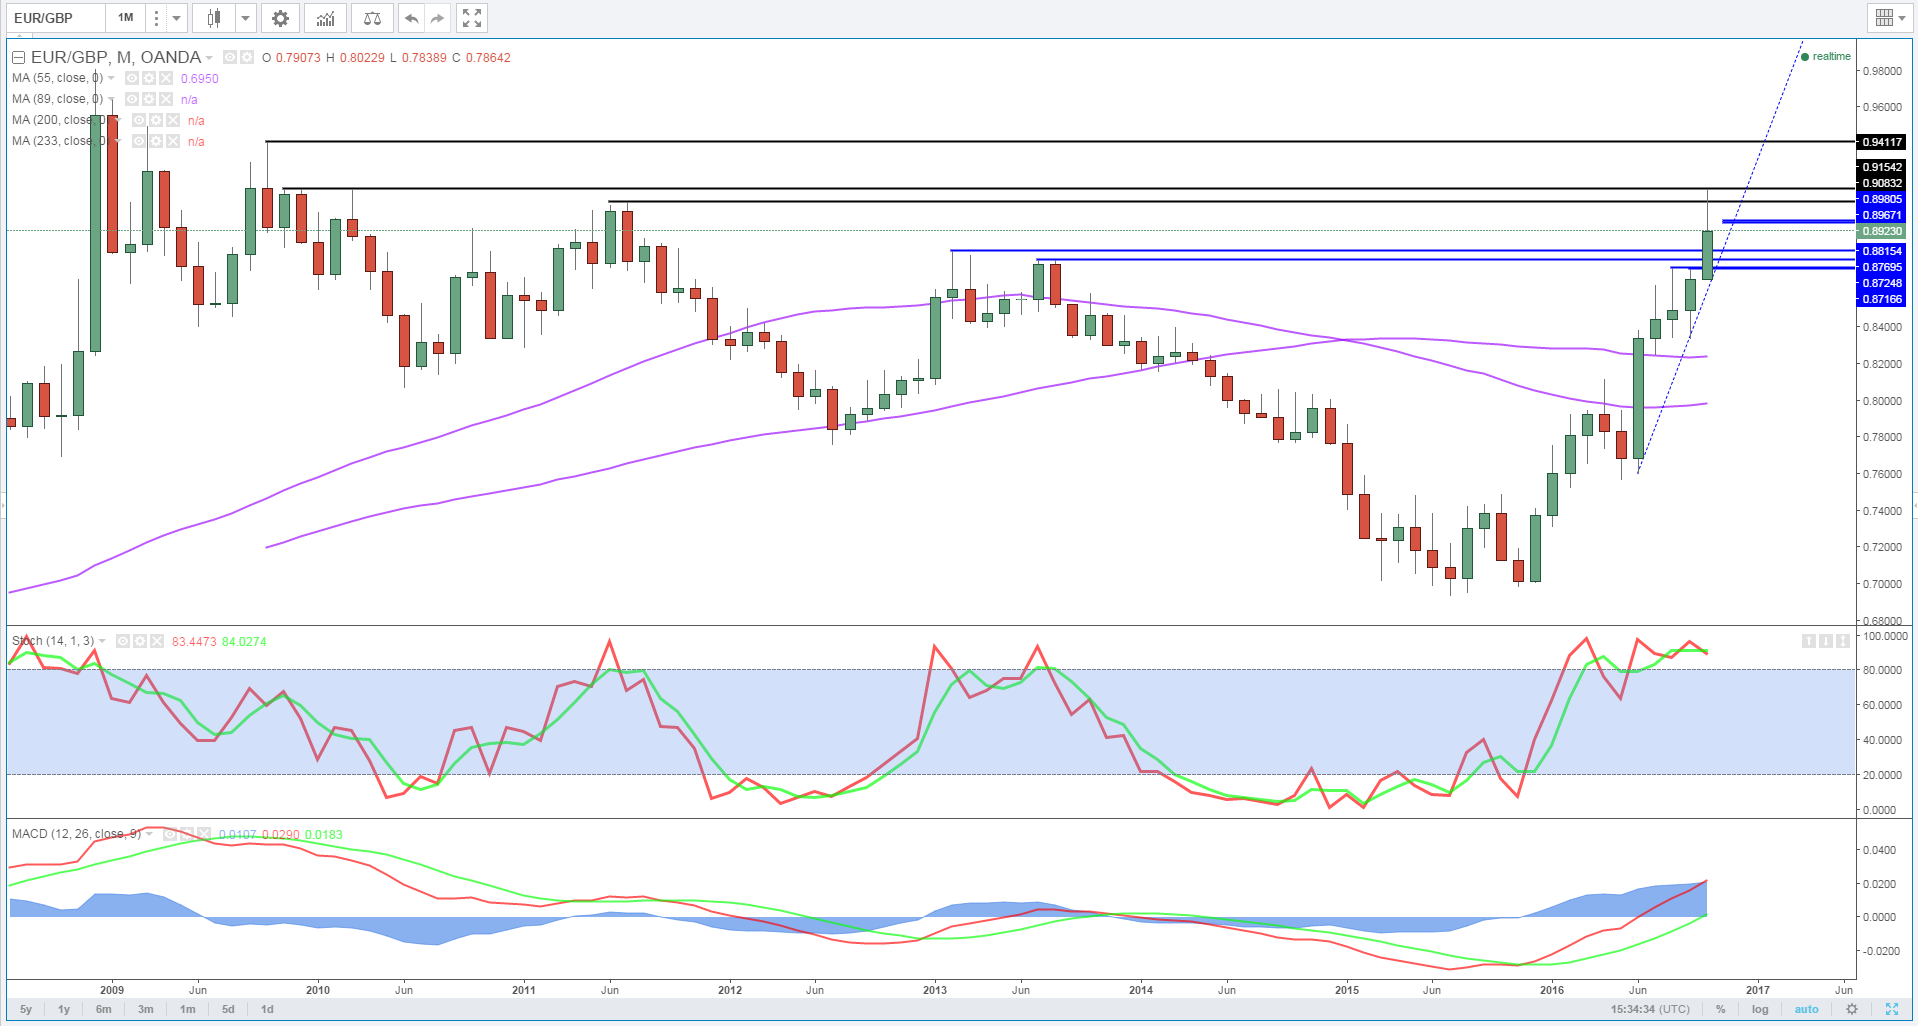
OANDA fxTrade Advanced Charting
A break lower had always looked more likely at these levels, with the pair having made lower highs at the last three times of asking despite traders repeatedly buying the dips around 0.90. While this never created a textbook descending triangle on the chart, the message was the same.
WTI/USD – US Crude Steady at $50, Crude Oil Inventories Next
Taking into consideration the size of the opening of the descending triangle (albeit a very rough one), we get a possible projection level for the pair around 0.88, which coincides with the next key support zone.
The pair found strong resistance around this level – 0.8770-0.8815 – back in 2013 and so this could be a logical area of support on this occasion.
The pair could also find support around these levels from the ascending trend line – 24 June lows – a break of which could signal a much more significant moves to the downside.
![]()
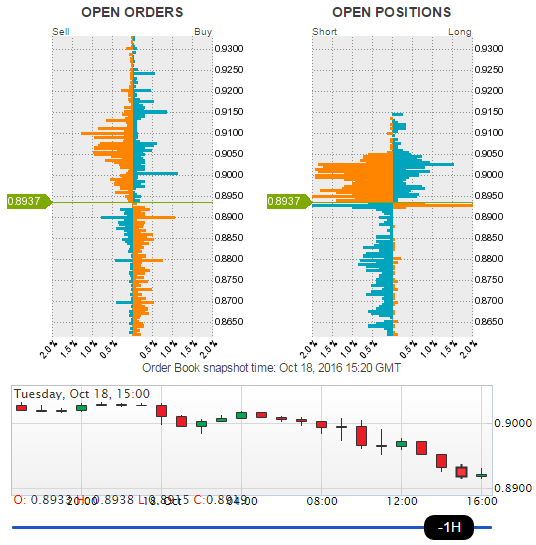
You can find these and many other tools on OANDA fxLabs.