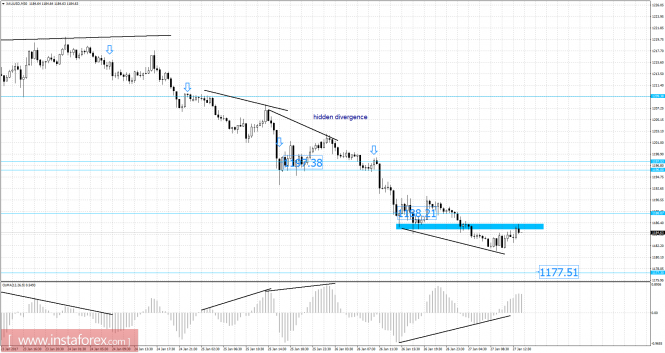
Recently, gold has been trading downwards. As I expected, the price tested the level of $1,181.31. According to the 30M time frame, I found unconfirmed bullish divergence on a Moving Average Oscilator, which is a sign of potential strength. To confirm bullish divergence, the price needs to break the level of $1,191.50. Anyway, the trend is still bearish and Gold could visit the level of $1,177.50. Watch for selling opportunities on the pullbacks as long the price has not confirmed bullish divergence.
Resistance levels:
R1: 1,197.00
R2: 1,200.30
R3: 1,205.70
Support levels:
S1: 1,186.20
S2: 1,182.90
S3: 1,177.55
Trading recommendations for today: Watch for potential selling opportunities.
The material has been provided by InstaForex Company – www.instaforex.com
The post Gold analysis for January 27, 2017 appeared first on forex-analytics.press.